|
A/B Hypothesis Testing on this database proved to be more challenging than I initially thought it would be. I'm good at asking questions, I like using SQL and math is my thing. But this project had me sitting and thinking quite a bit more than I bargained for. In a previous project where I was creating a multilinear regression model on King County Housing Data, there was a lot of step-by-step work like cleaning data, checking for multicollinearity, normalizing and transforming data, selecting features. This one was more thought oriented and, dare I say, experimental. Asking the right questions was the key. But, then again, asking the right questions takes some time. Here, I'll show you the question that I enjoyed asking the most and my process in finding the answer. First, the Northwind Traders database is one that was created by Microsoft to exemplify a company database and have users practice pulling data from it with SQL queries. Here is the entity relationship diagram (ERD) that visually explains how the database is organized. 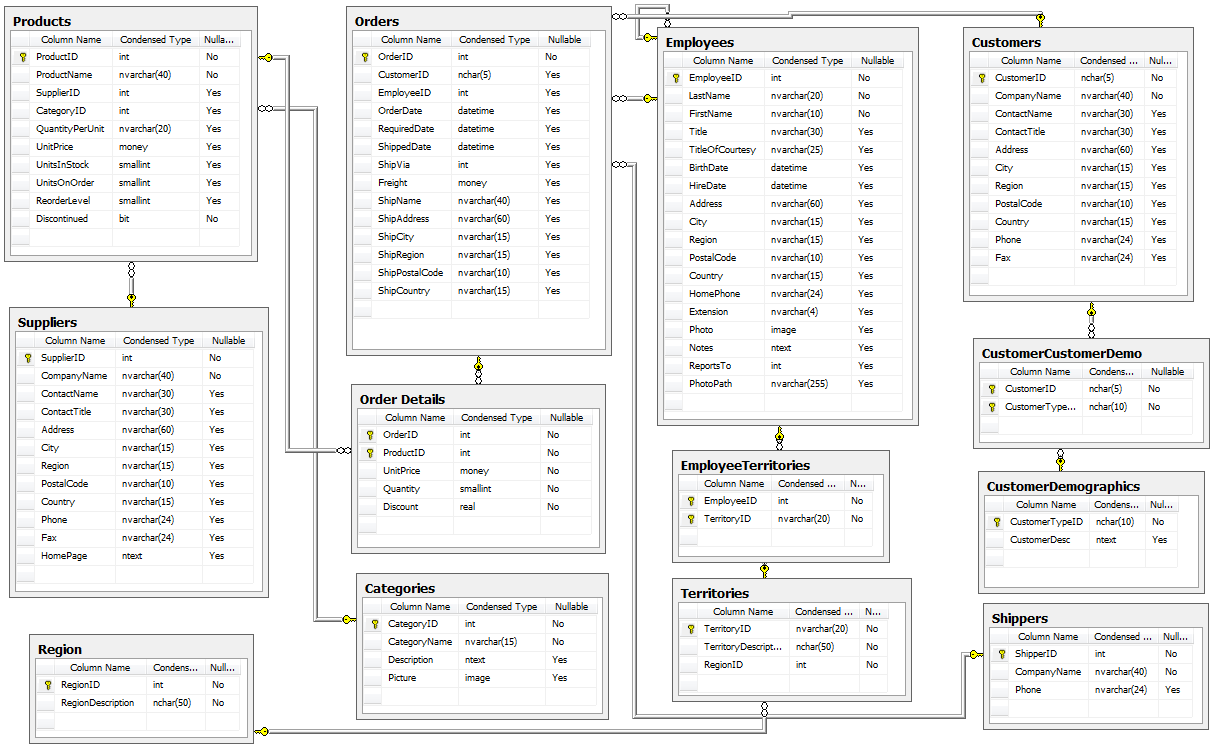 STEP 1: Ask a relevant question that could potentially drive a business decision and be advantageous for the company. Finding questions that compare the means of two distributions can be overwhelming when looking at a complex ERD. But, take a deep breath and focus on what is important to the business. In my case, I wanted to ask a question that focused on the employee and their success in the company. As administrators and managers are always looking to increase sales, while also walking the fine line of overburdening their sales employees with more customers to manage, this question can show whether or not adding large customer areas (in this case regions) might add more sales. With territories all over the world, the Northwind Traders company has 9 employees who have anywhere from 2 to 10 different regions they are responsible for. Here, I ask the question as it pertains to the employee and their region amount. Question: Do employees who cover more territories sell higher quantities of products? Hypothesis: Null: There are no significant differences in the employees who cover a larger amount of territories (more than 6) than the employees who cover a smaller amount of territories (less than 6). Alternative: There are significant differences in the amount of products sold by employees with a larger amount of territories than employees with smaller amounts of territories. STEP 2: Gather the necessary data to analyze your question. Using SQL queries to pull down the data in a workable format is necessary in this case. It is necessary to create data frames with useful information that can be analyzed in statistical tests. For this question, I needed data on the employees, the territories they oversee and the details of their orders. 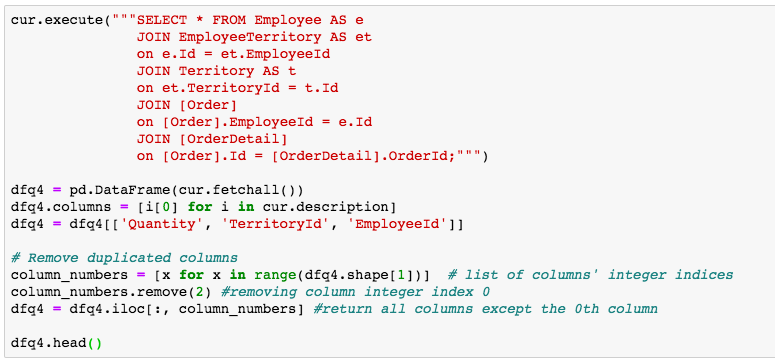 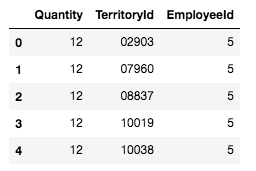 STEP 3: Break your data down into control and experimental groups. Here I designated employees with more than 6 territories as the experimental group, leaving those holding less than 6 territories as the control group. For each group, I gathered the quantity of each sale they made and took the averages of both group quantities. 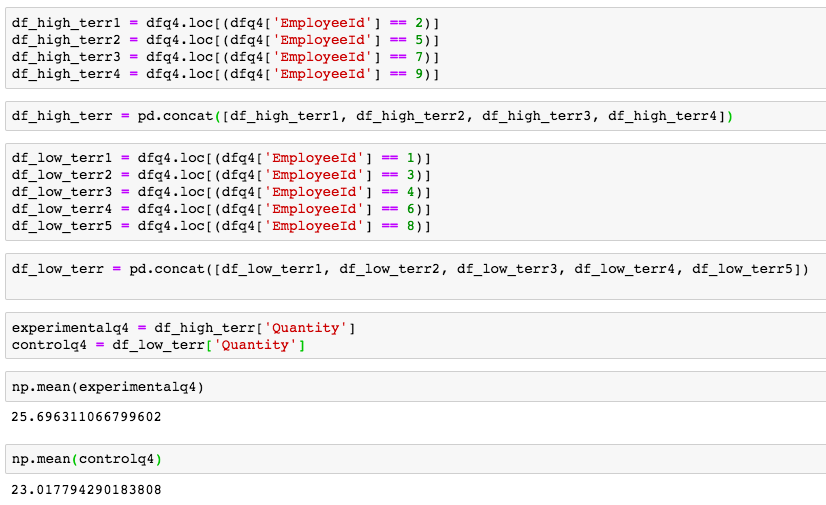 STEP 4: Check to ensure the data is normal and visualize the distributions. A two sample t-test relies on the data distributions being normal. Here, I've used qq plots to visualize the normality of the data. 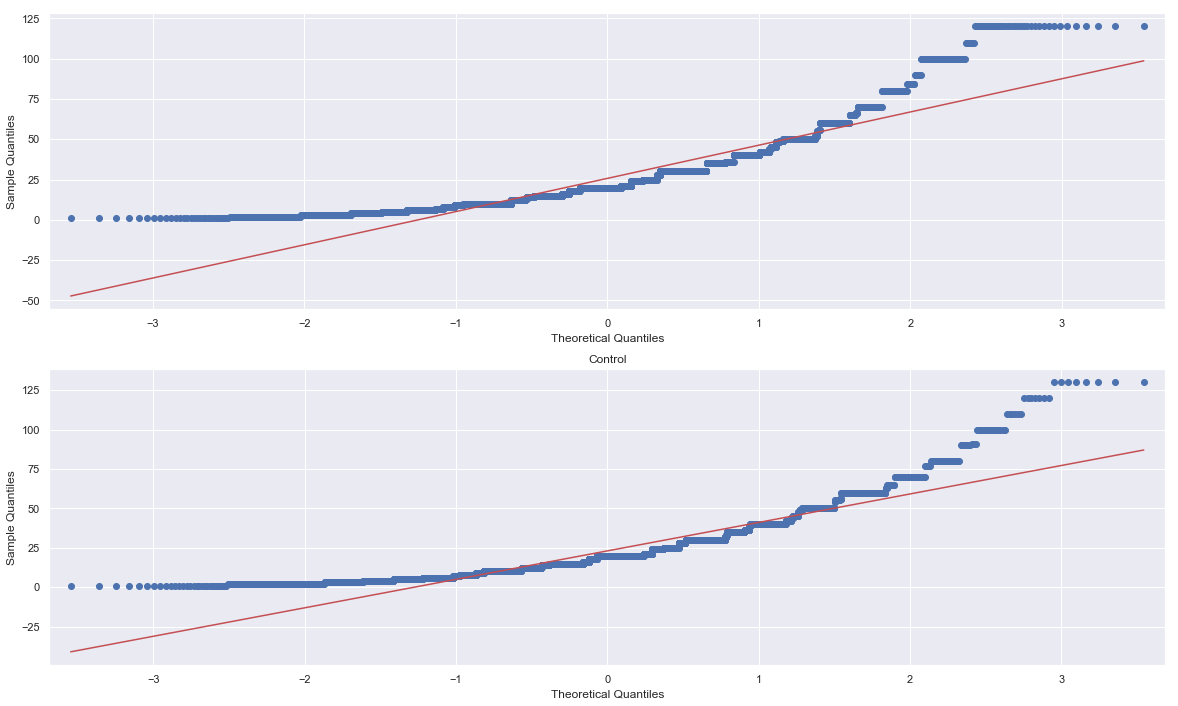 A check on normality using qq plots. 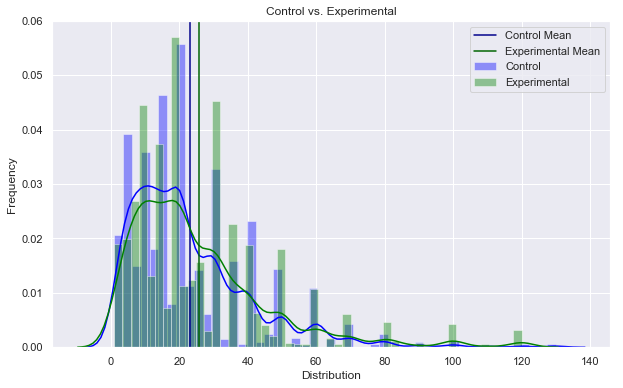 A visualization of the compared distributions. STEP 5: Run the experiment and interpret the results. Using the two sample t-test, we look to see if the p value is greater than the alpha value, in this case 0.05, to reject the null hypothesis. But, if the opposite happens and the p value is less than the alpha value, we accept the alternative hypothesis and determine what the statistical difference is. 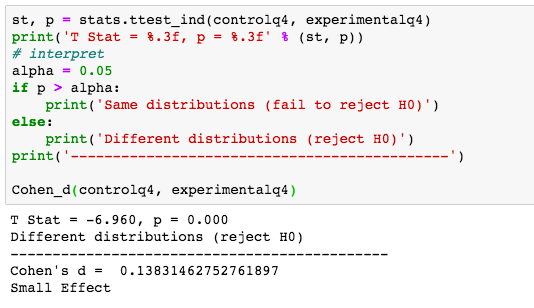 Given our results we can see that the null hypothesis has been rejected and that there are significant differences in the quantity of sales between high and low territory employees.
To wrap up, the question to ask is, what business questions does this answer? Well, let's say one of our younger employees has shown a lot of potential and management is interested in giving the young fellow more responsibilities, even, a whole new territory! With the results of our test, we can be confident that giving the up and comer this promotion could lead to more sales. Full Git Hub Repo: https://github.com/lucaskelly49/A-B-Hypothesis-Testing-on-NorthWindTrade-Database/blob/master/Student.ipynb A few sources: https://machinelearningmastery.com/nonparametric-statistical-significance-tests-in-python/ https://www.datanamic.com/dezign/erdiagramtool.html https://towardsdatascience.com/inferential-statistics-series-t-test-using-numpy-2718f8f9bf2f https://blog.minitab.com/blog/adventures-in-statistics-2/choosing-between-a-nonparametric-test-and-a-parametric-test
0 Comments
Leave a Reply. |
 RSS Feed
