|
Robinson Cano has not had the season that the Mets were hoping for (I can hear the NJ/NY accent, 'You're telling me!' from over here) But this post is not about Cano and the Mets, but rather whether there is a pattern within sluggers changing their swing to increase their launch angle and getting beaned. It really is amazing how many words can be used to explain the HBP.
Cano has only been plugged twice this season and his launch angle has consistently been below 10. But what about other guys who seem to keep getting hit? Reds slugger Derek Dietrich was all over the news feed a few weeks ago when he was hit 6 times within the same series against the Brewers. To date, Dietrich has been nailed 16 times while hitting with an average launch angle of 19.3 this season. This led me to the question, does having a higher launch angle make you more likely to be hit by a pitch?
I remember listening to announcers discussing how part of a higher launch angle swing's mechanics involve starting the hands faster. Looking at both of the videos above, you can see how quickly the hitter's hands start to move through the zone. It seems that a lot of hitters are starting to move their hands before they even see that the pitch is coming inside. Is there a correlation between a higher launch angle and more HBP's?
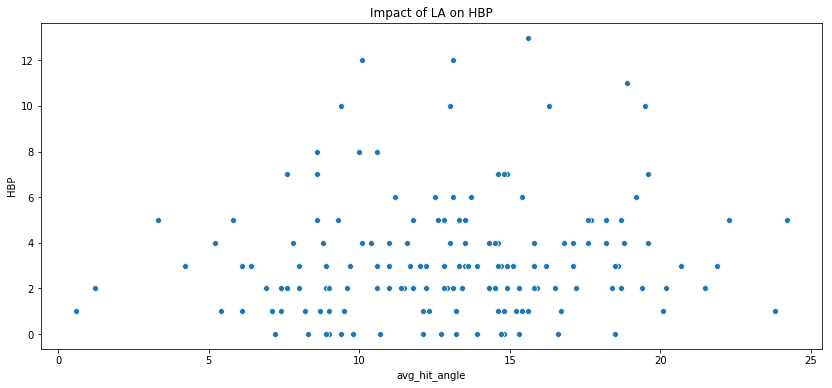
Upon first look...no...not really. In the above graph you see all data from the 2019 season for batters with at least 213 AB's. The HBP and LA (avg_hit_angle) variables only have a correlation score of .11, meaning, little to no correlation. Though the number is positive, indicating that even though it may not be significant, as LA increases so does HBP.
Here's a break down of the top 5 batters in this graph: 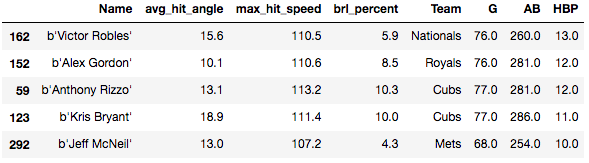
You'll notice that they are all above a 10 for average launch angle. Dietrich would be in the top spot, but he misses the mark with the AB cut-off. Which makes it even more interesting that he has been hit so many times this season. When I limit the data even more to only include hitters with an HBP stat greater than 5, the correlation actually decreases to .07.
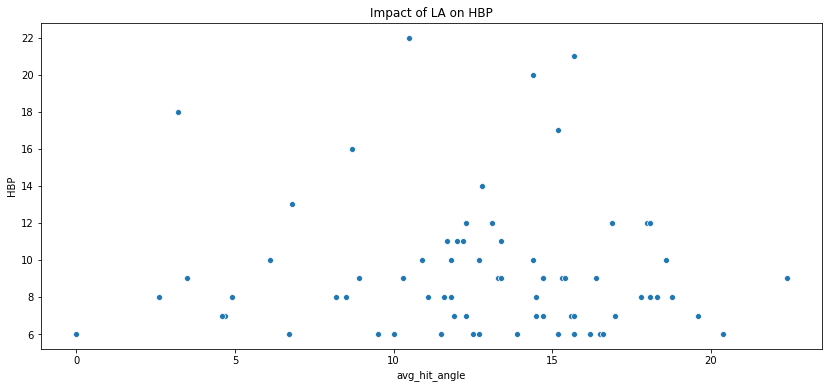
My next thought was to apply this same correlation test to last season's data to see if the correlation numbers would increase with more data. The result was that the opposite happened. Changing the data in the same way, to include players with at least 213 AB's and more than 5 HBP, the correlation was a negative .04.
In the end, this data shows there is no correlation between players launch angle and the amount of times they get jammed. But, maybe you see something I don't. Clearly batters are changing their swings to increase their launch angle, but swings are so diverse and unique to the player. It would be hard to say that a higher LA always moves the hands quicker and therefore opens hitters up to getting hit.
Stay tuned for another analysis involving LA, HBP and statistical significance to see if looking beyond correlation can give us further insights.
0 Comments
Introduction
Sunday night baseball is such a great thing. Yes, I may fall asleep around the 6th or 7th, but I fall asleep to baseball, which is nice. It's such a summer feeling for me to have the window open, the summer breeze blowing in and talk of baseball in the background. Last night, the Cubs were aggressive early on the base paths. At one point, with Schwarber on first and Bryant at the plate, Bryant hits what would typically be a routine single to left-center. Now, with the Cardinals and the Cubs fighting it out for the top spot in the division, you'll see an aggressive approach by Schwarber. Did master mind Joe Maddon have that all planned and ready? Did he tell his team to run on Ozuna? Well, if so, maybe he (or his team of data scientists and analysts) was evaluating the rARM statistic.
Part 1: The Stat - Throwing Arm Runs Saved
A player's total Throwing Arm Runs Saved is then the sum of our three halves: flyballs Runs Saved + groundballs Runs Saved + Miscellaneous Kills Runs Saved.
- The Fielding Bible After researching the Ozuna question and trying to find the statistic that would best explain the decision to run or not to run, I settled on the Throwing Arm Runs Saved statistic and it's detailed approach to quantifying an outfielder's ability to hold runners on base. A very detailed overview of this statistic can be found here. But, I'll do my best to break it down: The Three Categories: The statistic is built around three categories in which each one counts: 1. When a runner moves an extra base. For example, when a runner advances from first to third on a single just like in the case of Schwarber and Ozuna. This is known as "Moved" 2. When a runner does not move an extra base. This would have been the case if Schwarber stayed at second or when a player simple goes from "station to station". This is known as "Did Not Move" 3. When a runner gets thrown out trying to take the extra base. This is known as "Thrown Out" The Calculation Each fielding position (infield and outfield) is broken down into zones or buckets, which take into consideration where the ball landed or where the play was made. For each of these positions and for each of the instances above, percentages are calculated. So, for example, the percentage of times the ball is hit left-center of Ozuna and a runner takes the extra base, or is "Moved." (1) Fly Ball Arm Runs Saved League Average: Percentages of "Moved", "Did Not Move" and "Thrown Out" for each zone, at each position, for each situation. Opportunities: # of times runners move on a player + # of times runners don't move on a player + # of throw outs Expected Runs Saved: opportunities x the league average The difference between expected and actual x the run value of each play (2) Repeat above calculation for Ground Balls Runs Saved (3) Miscellaneous Kills Calculate the league average: Take the number of miscellaneous kills per touch (the sum of miscellaneous kills / total number of touches) Calculate expected miscellaneous kills: Multiply league average by the player's touches The difference in expected and actual x run value Outfield Throwing Arm Runs Saved: (1) Fly ball arm runs saved + (2) ground ball arm runs saved + (3) miscellaneous kills Part 2: The Arm of Ozuna
With this complicated and in-depth defensive metric, the real question is a two parter:
(1) Are the Cubs using such a statistic to run on Ozuna? (2) Who are the people actually calculating this metric? Like, actually measuring the percentages in each zone? That's crazy! 
Let's see how Ozuna stacks up:
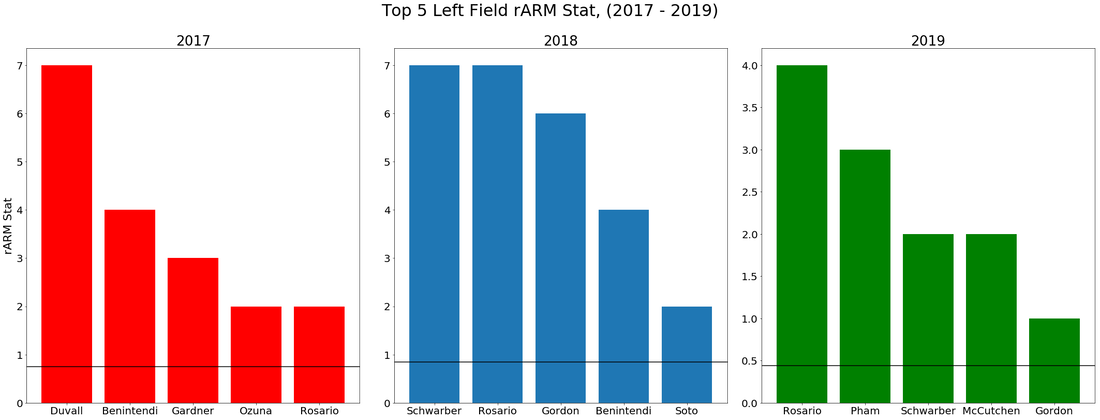
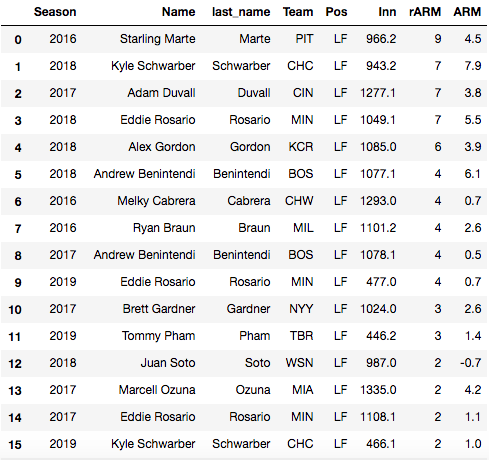
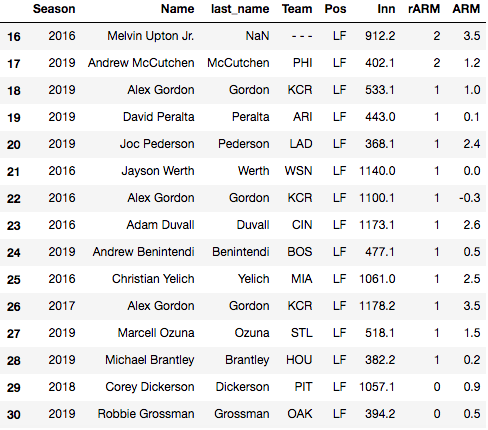
Looking at the first chart on the left, we see that Ozuna shows up just above the league average (indicated by the horizontal line) We also see no Ozuna in seasons 2018 (middle chart) and 2019 (right chart) So, clearly teams can feel like it is worth the risk to run on Marcell in this current season. Here's the top 30 left fielder's as measure by the rARM stat in the past three seasons.
Interestingly enough, Ozuna shows up in the top 30 twice, once in the 2017 season and once again in the current 2019 season, just above the league average of 0.5. A second interesting piece is that the runner who took that extra base was Kyle Schwarber, who's 2018 season had him as the 2nd highest rARM stat in the past three seasons and this season (2019), he's above average. This may just suggest that when a left fielder is sizing up another left fielder, there may be more of a reason to run and show a more aggressive approach.
Did the first base (or possibly third base) coach take all these factors into consideration? Maybe. But, maybe not. Maybe Schwarber just had an extra cup of coffee that day. The point is, you can run on Ozuna, but beware, he is above the league average this season for the rARM stat.
References:
https://sabr.org/research/measuring-defense-entering-zones-fielding-statistics http://www.fieldingbible.com/methodology-ofarms.asp https://www.fangraphs.com/leaders.aspx?pos=lf&stats=fld&lg=all&qual=y&type=1&season=2019&month=0&season1=2016&ind=1&team=0&rost=0&age=0&filter=&players=0&startdate=2016-01-01&enddate=2019-12-31&sort=10,d https://library.fangraphs.com/defense/drs/ |
AuthorThis blog is dedicated to baseball analytics and general baseball discussion. Archives
January 2021
Categories |
 RSS Feed
