|
Zack Greinke is so much fun to watch. He has an approach to the game that is numerically calculated. He's a data guy's data guy. Below you can watch Greinke perform when the pressure is on. With a 2-0 count on slugger Aaron Judge with a runner on first in the bottom of the 5th and only 1 out, Greinke pitches a beautiful, clutch.....ball? Wait, what? For real? Is that a joke? Was the umpire fighting off a sneeze? What is up with that?
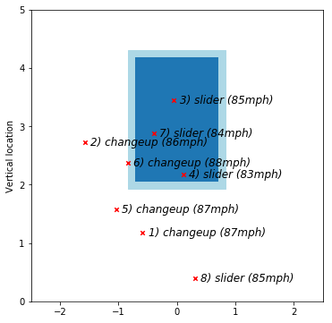
Let's do some digging to see what is really going on. Take a look at pitch number 3 below in Figure 2. The slider coming in at 85 mph was so much a strike according to PitchF/X that it still has a few inches in all directions before it is clearly a ball.
The truth is, I wouldn't want to get behind the catcher and have to decide whether Greinke pitched a ball or a strike. The movement on his slider alone would make me fall backwards and go cross-eyed in confusion. But, the job must be done. I would like to know how many times the home plate umpire missed during this game, and specifically for Greinke alone. Let's take a look:

When slicing the PitchF/X game data to only show Greinke's pitches in which the umpire had to make a call we can see how often the umpire got the call right compared to PitchF/X locations. In other words, missing from this data are balls in play, foul balls, HBP, etc.,. Looking at the confusion matrix, we see that the umpire and the computer system both called strikes 20 times. However, the umpire called 9 strikes that the computer designated as balls. So actually, Greinke received 9 strike calls that would have been designated balls had a robo-umpire been used. How many times did Greinke loose out on a call? Just once. It's at the top of this blog post.
How about on the other end? Masahiro Tanaka pitched a full 5 innings in this game and faced 1 batter in the 6th. Let's look at only Tanaka's pitches. 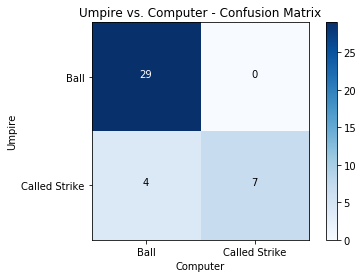
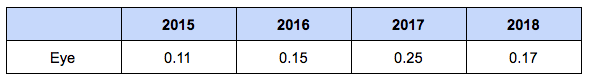
It looks like Tanaka also benefited from a few calls. 4 times did the umpire call a strike when the computer would have called the pitch a ball and Tanaka did not have any missed strike calls.
Some calls are not hard to make, some are. In the case of the one missed call by the umpire this day, who knows? It seemed like a pretty straight forward call on video. I'm going with the "sneeze fight off" theory. All in all, the umpire did a great job during this game but one does have to think what might have happened had Greinke gotten that 2-0 strike call, making it a 2-1 count. We will never know. What we do know is that had a robo-umpire been behind the plate that day, both pitchers would have pitched less strikes.
References:
https://www.mlb.com/gameday/astros-vs-yankees/2019/10/17/599360#game_state=final,lock_state=final,game_tab=box,game=599360 https://github.com/lucaskelly49/Work-Samples-from-The-Pick-Off---A-Baseball-Blog/blob/master/The%20Day%20Zack%20Greinke%20Needed%20a%20Robo-Umpire%2C%20Or%20Did%20He%3F/Greinke_Judge.ipynb
0 Comments
In the start of Ben Lindbergh and Travis Sawchik's new book, The MVP Machine, the authors focus on players who have drastically improved their game by way of embracing the data. Checking in on Trevor Bauer during the winter of 2018, Lindbergh and Sawchik tell the story of Bauer's exhaustive data collection from the mound, using high definition photo's of his delivery and the resultant pitch.
There have been many debates and great articles written about the arm slot. From The Hardball Times, article on varying arm slots and the pitch types they create, to the extensively detailed breakdown of biomechanics by Graeme Lehman, there is a lot to be uncovered in the angles. Here, I'll detail how a deep-learning model could potentially give great insight to a pitcher's future and valuation. 
What is deep-learning?
Deep-learning is a division of machine learning that was inspired by the human brain and the firing neurons that make us able to transmit information all over our bodies. Thus, the neural network is a form of deep-learning that transmits information data through a vast network of similar neurons and makes decisions based on it's analysis. For more on deep-learning visit the best resource for such things, Machine Learning Mastery. A version of this deep-learning is called a convolutional neural network (CNN). This network is best at what is called, computer vision. Basically, computer vision is a form of AI that allows a computer to interpret images in a way a human might. Here's a version of this type of network that I created to analyze images of clothing to determine what category of clothing (hat, shoe, coat, shirt) it belongs to. The network takes in an image, interprets it pixel by pixel, does some serious mathematics and then, spits out a category, like, "This is a shirt" or, in the case of an image of a pitcher, "This is a pitcher who is likely to develop a shoulder issue in the next 6 months if they do not change their arm slot." 
What can a CNN do?
Let's use a hot topic, injuries. Wouldn't it be nice if MLB organizations could better predict the likelihood of a young prospect pitcher developing a serious arm injury? Think of all the young prospects who show so much potential only to be sidelined for 2 years with a UCL injury. Could we have predicted Michael Kopech's injury without a deep-learning model? Probably. But, what about all the other young prospect pitchers who show so much promise. How can a CNN help? Going back to the story of Trevor Bauer and his off-season workouts, think about all the images he was collecting. Let's imagine over the course of the winter, Bauer and a number of other pitchers collected thousands of images. What if those images were saved and stored. Who would do that? Well, a place like the gym where Bauer was working on his mechanics, Driveline Baseball could do something like that. But, the question is, what do you do with this data set of images? Time to let the CNN shine! First, we will need a baseline, a database of pitching delivery images of pitchers who later developed a shoulder issue, a UCL issue, needed Tommy John's surgery or some other type of common pitcher injury. Once we have this we can train the network on these images. We should also have a large dataset of pitchers who did not develop an injury. We would essentially give a category to those pitcher images analyzed in the form of a type of injury or no injury and then train the network with these categorized images. If we categorized images with no injury as a 0, we could say a 1 is a UCL injury, a 2 is a should issue, a 3 is a forearm issue and so forth. Next, we could use this network in determining an upcoming player's valuation. Do they have a delivery that our network categorizes as a potential injury (a 1, 2, or 3) candidate? If so, can we get the young pitcher to alter their delivery to save their arms and then re-analyze? Can we de-value those players who are unable to change their delivery and keep driving down the road to injury? The benefits of running a model like this kind of computer vision CNN would be very beneficial to MLB organizations looking at draft picks, developing scouting and valuing free-agents. Of course, with all big data projects the requirements are concrete, but the technology to acquire and analyze this data is present in many baseball companies and organizations. Just let me know if you would like it done for yours. I'm open to working weekends.
I love good defense. Watching a center fielder chase down what should have been a blooped in single and creating a shocked reaction from the baserunner as he turns and realizes he's out is priceless. That classic, one hand in the dirt, rest of the shortstop's body flying through the air snag, is truly my favorite. I know what people say about the excitement of a home run and I get it. The rifle-like, cracking sound of bat on ball, closely followed by fans standing and cheering and spilling and spitting! God I'm going to miss baseball this winter!
As as the season comes to a close, we celebrate more than just home runs. We celebrate and award players for all their actions on and off the field. With that, it's nearly time to award the best defensive players of the year with the Rawlings Gold Glove Award. There's nothing like having a gold glover on your team and being able to watch them hold it down in the field all season long.
The Rawlings Gold Glove Award
Like many awards, managers and team coaches get to vote. Managers can't vote for players on their own team and they have to stay in their own league (AL/NL). In addition, they have to vote for players who qualify (mostly needing at least 713 total innings) as laid out by Rawlings. It's nice to have the men who are closest to the game voting and giving out these awards. But, there must also be some quantifiable way to determine who is deserving. According to Rawlings, 25% of the vote is left up to metrics. Using the SABR Defensive Index, advanced analytics are now built into the award. This index is includes: - Defensive runs saved (DRS) - Ultimate Zone Rating (UZR) - Runs Effectively Defended - Defensive Regression Analysis - Total Zone Rating 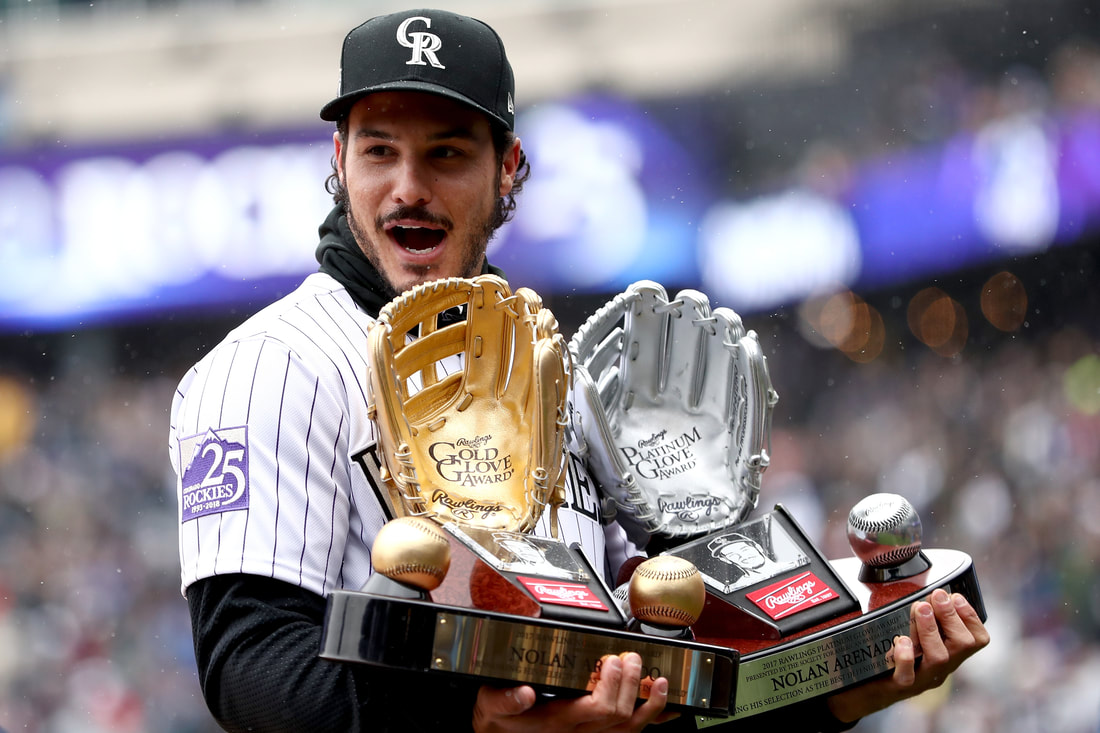
Sometimes players just jump over the gold and go platinum.
What about Machine Learning?
What if we could take that 25% of the vote coming from data and boost it? What if we still left the 75% up to a vote among the coaches, but were able to give them a pool of the most qualified players based on the metrics. What if we learned from the past to predict the future? Let's let computers create a pool of players each year to vote from. Okay, sure, old-school coaches and managers could vote outside of the pool of candidates if they felt the computer just doesn't know what it's talking about. Just check the 'Other' box and fill in your vote. Here's how it's done. Using Fangraphs.com's leaderboard, I downloaded standard and advanced defensive metrics from 2002 on. This 2002 limit is due to the fact that it was in this year that advanced metrics such as (UZR, DFS, BIZ) began to be recorded. The model was trained on the following metrics:
If you compare the features held in this model to the SABR Defensive Index used to measure GG candidates likelihood of receiving an award, you can see how much more detailed and full picture the ML model is. Next, I attached a target column to this defensive fielding data, whether the player was awarded a gold glove at the end of the season (1 categorical variable) or not (0 categorical variable) Next, we let computers learn on these metrics, see who was awarded a GG based on specific metrics and voila! We have a trained model. The results were right in line with the SABR Defensive Index rankings (at least, through August 18th as the metrics have not been updated to reflect the end of the season)
Here are the model's predictions for GG awards in 2019. 3 Players are listed as candidates ordered from highest model score to lowest in each position in each league.
1B:
Hopefully you see that the pool of candidates provided by the ML model makes sense. For details on the work and code that went into this work, please see my GitHub link below.
GitHub link to notebook:
https://github.com/lucaskelly49/Machine-Learning-Model-Predicting-MLB-Gold-Glove-Award-Winners/blob/master/Student_Final.ipynb https://github.com/lucaskelly49/Work-Samples-from-The-Pick-Off---A-Baseball-Blog/blob/master/Machine%20Learning%20Our%20Way%20to%20the%20Gold%20Glove%20Award/2019%20GG%20Predictions.ipynb Resources: https://sabr.org/sdi https://www.rawlings.com/site-content/gold-glove-selection-criteria.html
Robinson Cano has not had the season that the Mets were hoping for (I can hear the NJ/NY accent, 'You're telling me!' from over here) But this post is not about Cano and the Mets, but rather whether there is a pattern within sluggers changing their swing to increase their launch angle and getting beaned. It really is amazing how many words can be used to explain the HBP.
Cano has only been plugged twice this season and his launch angle has consistently been below 10. But what about other guys who seem to keep getting hit? Reds slugger Derek Dietrich was all over the news feed a few weeks ago when he was hit 6 times within the same series against the Brewers. To date, Dietrich has been nailed 16 times while hitting with an average launch angle of 19.3 this season. This led me to the question, does having a higher launch angle make you more likely to be hit by a pitch?
I remember listening to announcers discussing how part of a higher launch angle swing's mechanics involve starting the hands faster. Looking at both of the videos above, you can see how quickly the hitter's hands start to move through the zone. It seems that a lot of hitters are starting to move their hands before they even see that the pitch is coming inside. Is there a correlation between a higher launch angle and more HBP's?
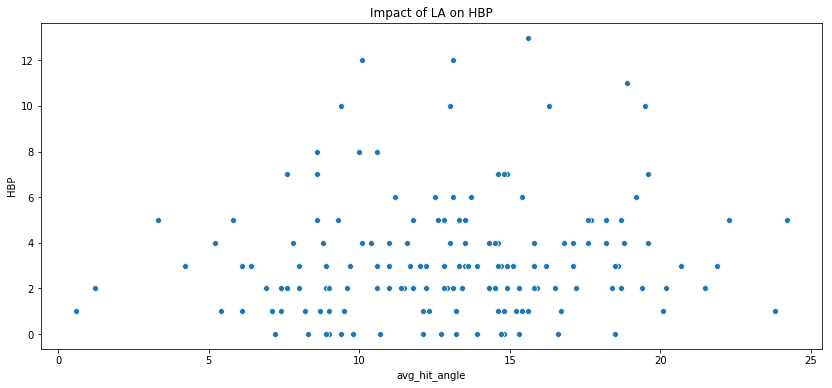
Upon first look...no...not really. In the above graph you see all data from the 2019 season for batters with at least 213 AB's. The HBP and LA (avg_hit_angle) variables only have a correlation score of .11, meaning, little to no correlation. Though the number is positive, indicating that even though it may not be significant, as LA increases so does HBP.
Here's a break down of the top 5 batters in this graph: 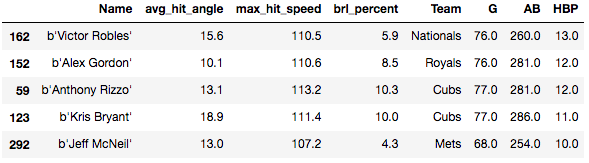
You'll notice that they are all above a 10 for average launch angle. Dietrich would be in the top spot, but he misses the mark with the AB cut-off. Which makes it even more interesting that he has been hit so many times this season. When I limit the data even more to only include hitters with an HBP stat greater than 5, the correlation actually decreases to .07.
My next thought was to apply this same correlation test to last season's data to see if the correlation numbers would increase with more data. The result was that the opposite happened. Changing the data in the same way, to include players with at least 213 AB's and more than 5 HBP, the correlation was a negative .04.
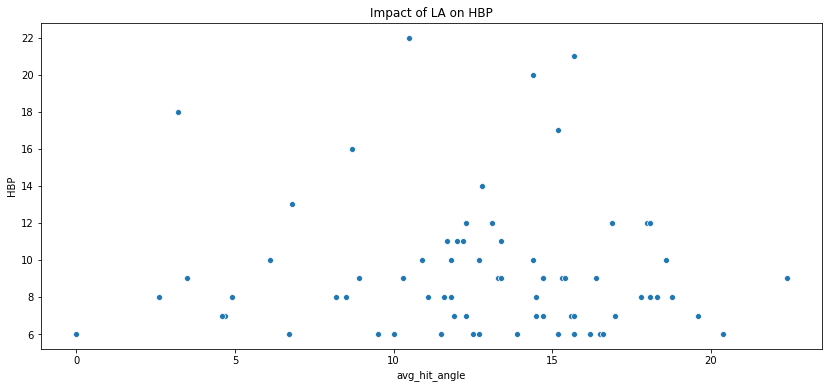
In the end, this data shows there is no correlation between players launch angle and the amount of times they get jammed. But, maybe you see something I don't. Clearly batters are changing their swings to increase their launch angle, but swings are so diverse and unique to the player. It would be hard to say that a higher LA always moves the hands quicker and therefore opens hitters up to getting hit.
Stay tuned for another analysis involving LA, HBP and statistical significance to see if looking beyond correlation can give us further insights. Introduction
Sunday night baseball is such a great thing. Yes, I may fall asleep around the 6th or 7th, but I fall asleep to baseball, which is nice. It's such a summer feeling for me to have the window open, the summer breeze blowing in and talk of baseball in the background. Last night, the Cubs were aggressive early on the base paths. At one point, with Schwarber on first and Bryant at the plate, Bryant hits what would typically be a routine single to left-center. Now, with the Cardinals and the Cubs fighting it out for the top spot in the division, you'll see an aggressive approach by Schwarber. Did master mind Joe Maddon have that all planned and ready? Did he tell his team to run on Ozuna? Well, if so, maybe he (or his team of data scientists and analysts) was evaluating the rARM statistic.
Part 1: The Stat - Throwing Arm Runs Saved
A player's total Throwing Arm Runs Saved is then the sum of our three halves: flyballs Runs Saved + groundballs Runs Saved + Miscellaneous Kills Runs Saved.
- The Fielding Bible After researching the Ozuna question and trying to find the statistic that would best explain the decision to run or not to run, I settled on the Throwing Arm Runs Saved statistic and it's detailed approach to quantifying an outfielder's ability to hold runners on base. A very detailed overview of this statistic can be found here. But, I'll do my best to break it down: The Three Categories: The statistic is built around three categories in which each one counts: 1. When a runner moves an extra base. For example, when a runner advances from first to third on a single just like in the case of Schwarber and Ozuna. This is known as "Moved" 2. When a runner does not move an extra base. This would have been the case if Schwarber stayed at second or when a player simple goes from "station to station". This is known as "Did Not Move" 3. When a runner gets thrown out trying to take the extra base. This is known as "Thrown Out" The Calculation Each fielding position (infield and outfield) is broken down into zones or buckets, which take into consideration where the ball landed or where the play was made. For each of these positions and for each of the instances above, percentages are calculated. So, for example, the percentage of times the ball is hit left-center of Ozuna and a runner takes the extra base, or is "Moved." (1) Fly Ball Arm Runs Saved League Average: Percentages of "Moved", "Did Not Move" and "Thrown Out" for each zone, at each position, for each situation. Opportunities: # of times runners move on a player + # of times runners don't move on a player + # of throw outs Expected Runs Saved: opportunities x the league average The difference between expected and actual x the run value of each play (2) Repeat above calculation for Ground Balls Runs Saved (3) Miscellaneous Kills Calculate the league average: Take the number of miscellaneous kills per touch (the sum of miscellaneous kills / total number of touches) Calculate expected miscellaneous kills: Multiply league average by the player's touches The difference in expected and actual x run value Outfield Throwing Arm Runs Saved: (1) Fly ball arm runs saved + (2) ground ball arm runs saved + (3) miscellaneous kills Part 2: The Arm of Ozuna
With this complicated and in-depth defensive metric, the real question is a two parter:
(1) Are the Cubs using such a statistic to run on Ozuna? (2) Who are the people actually calculating this metric? Like, actually measuring the percentages in each zone? That's crazy! 
Let's see how Ozuna stacks up:
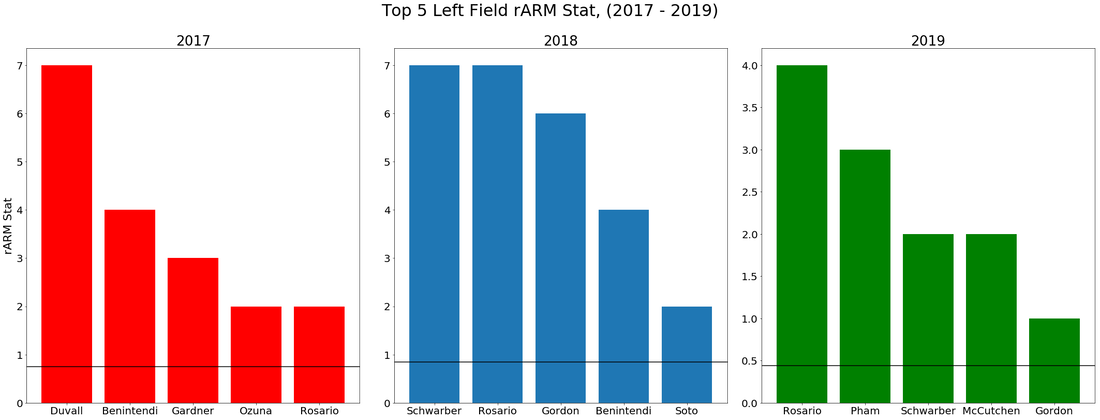
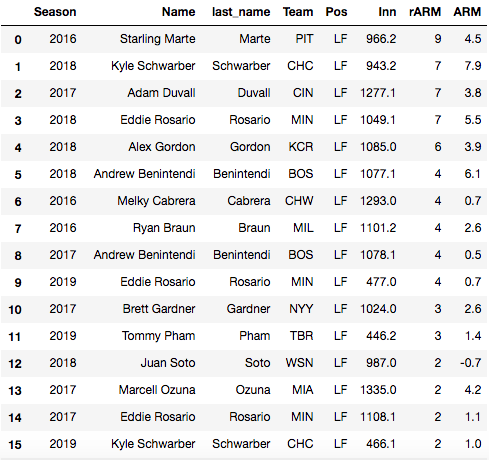
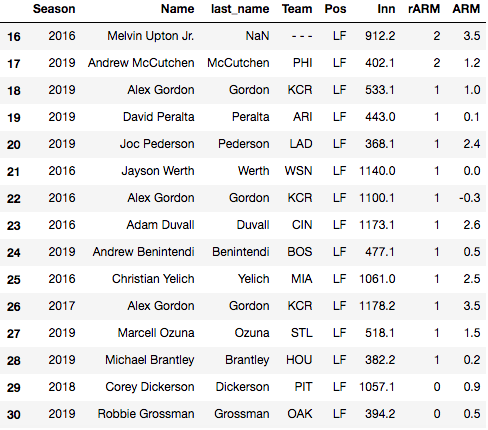
Looking at the first chart on the left, we see that Ozuna shows up just above the league average (indicated by the horizontal line) We also see no Ozuna in seasons 2018 (middle chart) and 2019 (right chart) So, clearly teams can feel like it is worth the risk to run on Marcell in this current season. Here's the top 30 left fielder's as measure by the rARM stat in the past three seasons.
Interestingly enough, Ozuna shows up in the top 30 twice, once in the 2017 season and once again in the current 2019 season, just above the league average of 0.5. A second interesting piece is that the runner who took that extra base was Kyle Schwarber, who's 2018 season had him as the 2nd highest rARM stat in the past three seasons and this season (2019), he's above average. This may just suggest that when a left fielder is sizing up another left fielder, there may be more of a reason to run and show a more aggressive approach.
Did the first base (or possibly third base) coach take all these factors into consideration? Maybe. But, maybe not. Maybe Schwarber just had an extra cup of coffee that day. The point is, you can run on Ozuna, but beware, he is above the league average this season for the rARM stat.
References:
https://sabr.org/research/measuring-defense-entering-zones-fielding-statistics http://www.fieldingbible.com/methodology-ofarms.asp https://www.fangraphs.com/leaders.aspx?pos=lf&stats=fld&lg=all&qual=y&type=1&season=2019&month=0&season1=2016&ind=1&team=0&rost=0&age=0&filter=&players=0&startdate=2016-01-01&enddate=2019-12-31&sort=10,d https://library.fangraphs.com/defense/drs/
We all know that pitchers in the major leagues can be...unpredictable?? But, isn't that why we're here looking at these charts, graphs and diagrams? It's a kind of fun that some of us like to have. There's no better way to mellow out after a long work day than digging into some real deep pitching metrics. I for one would it all day if I could.
In this year's Baseball Forecaster, writer Brandon Kruse gives some insight to the metrics from last season that may predict a breakout pitcher in an upcoming season. Using Kruse's research (more or less) here's what I targeted:
So, just who are these pitchers? 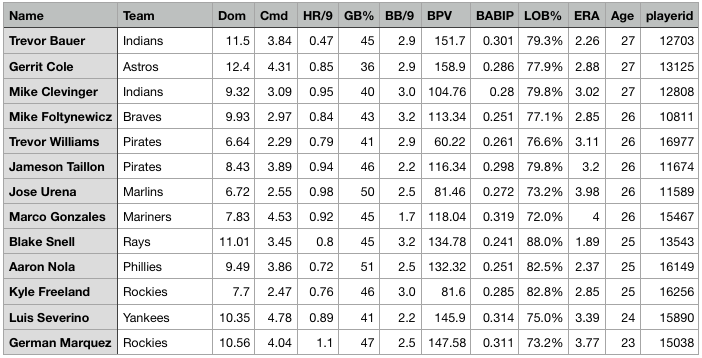
Now, this is a pretty good looking list. One that I am most interested in is Marco Gonzales, now easily one of the top pitchers in the Mariners rotation and hopefully, absorbing everything thing he can from veteran Felix Hernandez. Fitting Kruse's model for a potential breakout pitcher, Gonzales has the stats that could make for a breakout season.
After undergoing Tommy John Surgery in 2016, Gonzales was able to put together as close to a full MLB season as he could in 2018, pitching 167 innings and recording 13 wins. He showed improvement in all of the following stat categories between 2017 and 2018:
Beyond simply hoping his elbow surgery was a complete success that will set him up for durability moving forward, the only metric that I can find that has degraded slightly was his velocity in the 2018 season.
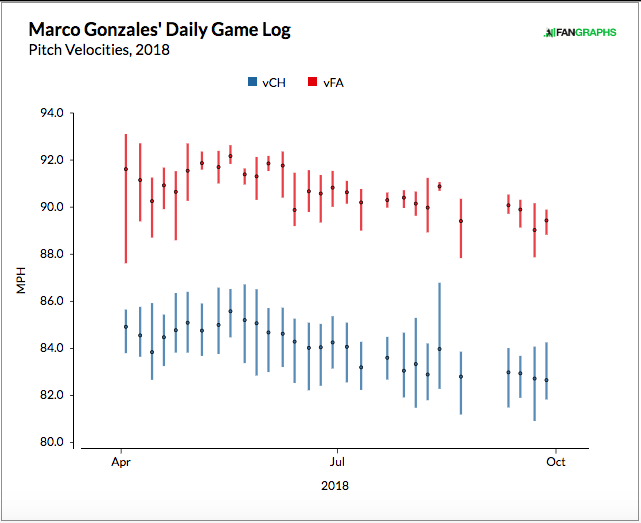
Image created on Fangraphs.com.
His velocity never went back up to the levels he was reaching in June. Oddly enough, a great article written by John Trupin for Lookout Landing discussed Gonzales' changing pitching mechanics in 2018's Spring Training, which lead to an increase in velocity. But, when we look at an updated version of a graph included in that article, we can see a slight drop off.
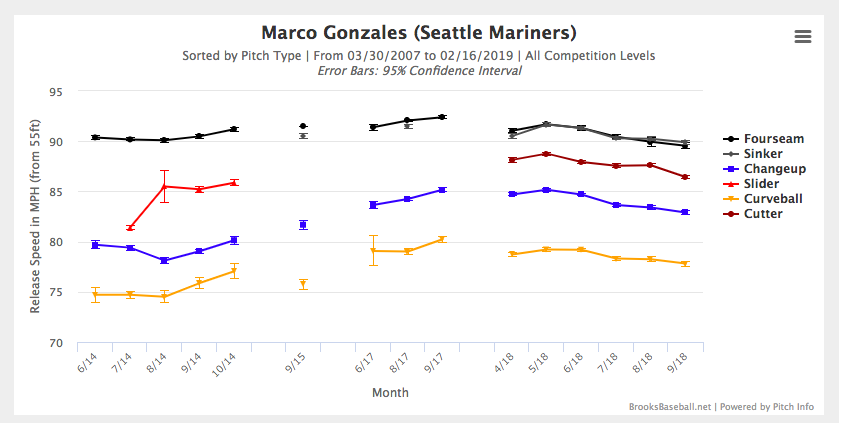
Image provided by Brooks Baseball.
When compared with his slightly changing G/L/F percentages in the first and second half of the 2018 season, there could be a small bit of concern.
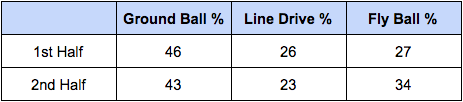
However, we could simply look at this as a clear case of fatigue towards the end of his first full season back after surgery and a change in pitching mechanics. It is clear that Gonzales has a lot of upside going into the 2018 season. With the loss of Paxton and the many additions and transactions the Mariners have made this offseason, one would assume the organization has a lot of hope for Gonzales to increase his IP and begin to take over as the ace of the rotation. His metrics certainly show that he has the skills to do so.
It wasn't long ago Machado and Schoop were turning beautiful double plays that became known in Baltimore like the Tinker to Evers to Chance plays in old time Chicago. Except, in this case, Machado to Schoop to...uh...Davis. Well, ok, that's for another time.
In 2017 Jonathan Schoop had an All-Star season. He hit 32 home runs and finished the season at .293/.338/.503. However, 2017, along with many of his teammates, was a bit lack luster. He still finished with 21 home runs, but a .233/.266/.416 slash line. Take a look at his power decline across the two seasons. 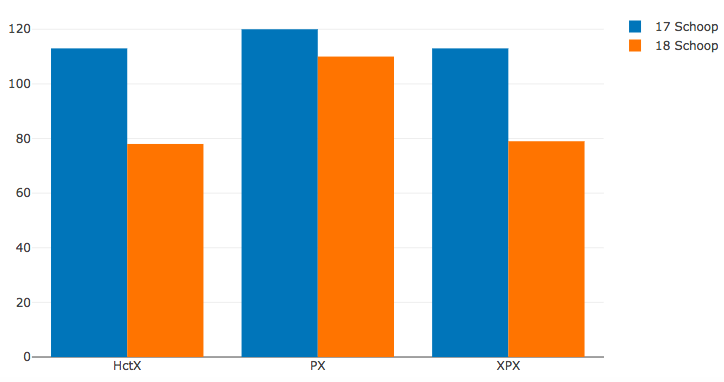
What happened? Iiiiinjurieessss!! Schoop found himself sidelined for 25 days with a right oblique strain. Here are a few other players who found themselves on the DL last season with the same injury.
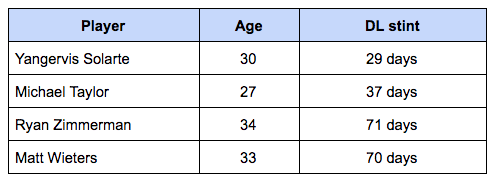
Man, the Nationals had it rough. At only 27 years old, Schoop spent the least amount of time off the field because of this injury compared to some of his older colleagues. I'm looking at you Zimmerman. Schoop is really only 27? That may mean that his body healed a little faster, but it could also mean that anxiousness to return to form and help his tailspinning Orioles teammates brought him back onto the field a little too early. After finally having the breakout season players must dream of, he probably wanted to get back in the saddle as soon as possible. Not to mention the fact that everyone knew the Orioles were on the cusp of a major sell off. He had to of known other teams were looking and maybe that pressure got to him.
Let's compare Jonathan Schoop to fellow second baseman, Jason Kipnis. In 2014, Kipnis spent 26 days, one day longer than Schoop with same injury, on the DL. If we look at Kipnis on the flip side of the injury and focus on his power stats, we can see the gains he saw in the 2015 season after recovering from his oblique strain. Kipnis showed a steady increase in hard contact, power index and an expected power index. 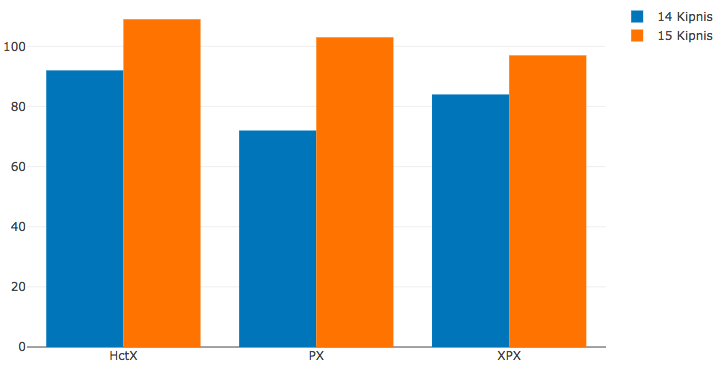
If this increase does directly translate to health in the oblique, Schoop could very well find himself generating more and more pop this upcoming season. There are a few reasons to believe this could be true.
First, Schoop has maintained a consistent contact rate over the last 4 seasons: 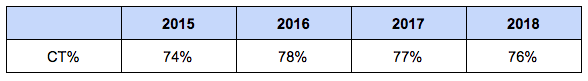
Second, his batting eye has increased each season in the past four seasons except for the 2018 seasons where it dropped off. But, this could also be a result of less at bats. The 2018 season had Schoop down 149 less ABs than in 2017. Also remember that he was traded at the deadline to the Brewers, who used Schoop as a platoon, bench role.
Finally, health and consistency go a long way. Now that Schoop is in Minnesota and knows his role, he can settle in to an opportunity where good health should have him back to an everyday role at second base. One can only imagine that the 2018 season for an Oriole was less than steady in more ways than one. Here's to seeing more power from Schoop in 2018.
|
AuthorThis blog is dedicated to baseball analytics and general baseball discussion. Archives
January 2021
Categories |
 RSS Feed
