|
How you can use your fantasy baseball roto league history to plan out your draft. If the sabermetrics revolution has taught us anything, it’s that as fans, we really don’t know what the heck we’re talking about. Various forms of bias creep into our minds that really have no statistical significance or can be proven totally wrong with a few numbers. Since playing fantasy baseball is a pretend fantasy of actually managing a baseball team, we’re allowed to totally screw things up. No one is going to fire you unless you’re one of those people who auto-drafts a team and then never looks at it during the season, don’t be that person. You can choose a player because he’s on your favorite team. You can say to yourself, “I think this guy’s totally going to break out this year”, without doing any research or having the data on a progression of skills to back you up. You can take who the average draft position (ADP) says you should take. But, none of those things will set you up to win. This year, I’m approaching my drafts like a robot who knows nothing of fandom or human connection, only numbers and stats. I’m not going to make any gut calls, any fan picks, or any huge gambles. I’m going to look at what the numbers say based on projections built on statistical models and I’m going to build a winning team. Want to join me, fellow stat-head robots? Here’s the easiest way to set yourself up to make the right picks going into your 2021 draft in 3 easy steps. Step 1: Don’t pay (much) attention to ADP Some ADP measurements can be good, like that on the National Fantasy Baseball Championship site, mostly because these are high dollar fantasy leagues and it cuts out bias a little more when the stakes are so high. Beyond that, ADP is mostly just telling us where other people did their drafting on average. Included in that ADP measurement are people’s biases, fan hoods, and weird, unexplainable expectations. People draft Player A because they really, really want him to be good. Even if Player A has never shown any of the necessary skills to be good at the major league level. Don’t let other people’s biases, hopes, and dreams affect the way you build your team. Step 2: Use projections There are many great projection systems in use today with some of the most popular being FanGraphs Steamer or Depth Charts, PECOTA, Pod Projections, and THE BAT-X. Each has its own variation of projection style, but any of these systems can be used for gaining an edge. This is not to say that there’s anything wrong with ESPN’s projection systems, but the projections listed above are typically more analytically driven, released way before ESPN’s and if everyone else is using conventional and you’re using synthetic...well...you have an edge, however small. I would recommend researching these systems and finding the one you like best or is most easily available to you. But if you’re all like, “Naw man, I don’t want to do research, just tell me what’s up.”, then I would say use Depth Charts from FanGraphs. Step 3: Calculate your league averages and find your players Now we get to the real meaty part, finding out how many stats you need to realistically contend for a top spot at the end of the year. Each season you’ve played in your league, there has been a winner. If you’re joining a league for the first time, well, there were still winner’s in the past. If it’s a totally brand new league, there certainly were leagues like it in the past and you can find them by doing some searching around whatever platform you're using. First, start by finding all the winners and their year-end stats. For example, my ESPN roto 5x5 (.obp instead of .avg) has been going for 5 years. I excluded 2020 from my averages because of the shortened season to get the following averages: R: 1030 HR: 316 RBI: 971 SB: 170 OBP: .360* * Use the calculation for OBP to help you figure out how many hits/walks/ABs you'll need, math can be fun! What you can do from here is figure out, depending on your roster size, how many of these counting stats you need for each of your rostered players. In my case, my offensive roster size is 11 players, so I need something around 94 runs per player: 1030 (total runs from above) DIVIDED BY------------------------------------------------------------------------- 11 (number of offensive players on my team) Obviously, that would be hard to do. You won’t be able to snag 11 players who will cover all of these stats. Maybe you can go after a top 10 run-scorer to balance out a player who might be under that 94 target. However, your goal is to always be around the projected total of 1030 runs from your starters when drafting.
One of the best things this draft style does is it eliminates the one stat players from your draft pool. Yes, you can pick up a shortstop who is expected to steal 25 bases, but that’s all you’ll get. Instead, look for a bunch of players who can steal around 10 bases. Some can project for 12 and some can project for 8, but you’re adding value with each player and trying to get as close to those necessary totals as possible. Remember, you’re using your projections to figure out what you can expect from a player. So go find the players who are well balanced and you’ll be surprised to see who pops up. So how will this help you win? The biggest reason you should use this system is to eliminate bias. As sports fans, we often throw out crazy, uninformed numbers. In the past, you’ve just reached for players because you had them the year before and they did pretty good, but you might have missed that article about the very visible skills decline with age that player has been showcasing. You might see someone who will steal higher than average bases but is empty in almost all the other stats. Don’t fall for it, let someone else take him. You are better prepared than most. In a way, this can be tough. We’re all fans of the game and we all have players that we lean towards because we just like them. But, if your projections are telling you what you need to know, being a fanboy won’t get you to that sweet, sweet victory stage, will it? No, it won’t. Instead, be like me, be a robot-machine-computer and take the stats and in turn, the trophy! A few summers ago, Walker Buehler and the Los Angeles Dodgers came to Baltimore at the very end of the season. That night my buddy and I couldn’t figure out why the Dodgers, and the overwhelming mass of Dodgers fans in attendance, were so pumped about winning a single game in Baltimore. Once we saw staffers in ties and headsets running out with the “Division Champions” t-shirts we realized what was going on. Needless to say, Buehler was excellent, going 7 innings with 4 hits and 11 K’s and, because it was the 2019 Orioles, gave up no runs. During the game, surrounded by really excited Dodgers fans, I mentioned to my friend that Buehler’s delivery seemed so efficient, that his motion looked exactly the same every time he threw the ball. If you’ve ever worked on physical mechanics of any kind, baseball swings, golf swings, freestyle swim stroke, running stride, or maybe just proper form sitting at a desk to avoid that ‘work from home/pandemic backache’, you know how hard it can be to exactly replicate a motion over and over again. Buehler amazed us in his ability to do just that. We know that repetition in delivery mechanics leads to success in various forms and the point of this analysis is to look at release point consistency and how that correlates with pitching metrics. Release Point Standard Deviation from Center Much like Alex Chamberlain’s work on launch angle tightness, release point variance seeks to quantify a pitcher’s ability to repeat a motion. Pitchers with consistent mechanics are known to be more efficient and if my thinking is correct, have more control. This research seeks to answer the question, does the ability to consistently release a fastball from the same location improve a pitcher’s control? Thanks to baseball savant, we can easily visualize release points by pitch type. Here’s a look at Walker Buehler’s four-seam fastball: 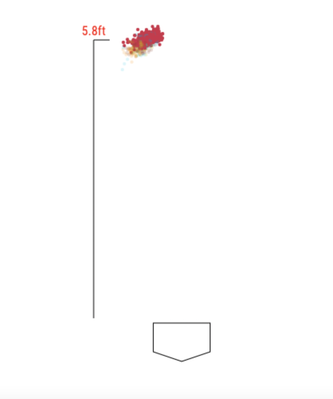 Looking at the clump of red dots being roughly 5.8 feet off the ground doesn’t tell us much, instead I used ‘pitch_release_x’ and ‘pitch_release_y’ metrics from statcast data to analyze the red dot clump. Looking at starting pitchers who threw four-seamers in 2020, I calculated the center of each pitchers’ release points, or the centroid. Once I had the centroid and any other individual pitch, or release point, that meant I had 2 points and could calculate the distance between those 2 points. Once I had that data for each pitch (the pitcher’s centroid and the distance of each individual pitch from that centroid) I could find the standard deviation of each pitchers’ distance from center. In the image below, you’ll see Walker Buehler’s four-seamer release points in blue and a red dot representing the calculated centroid: 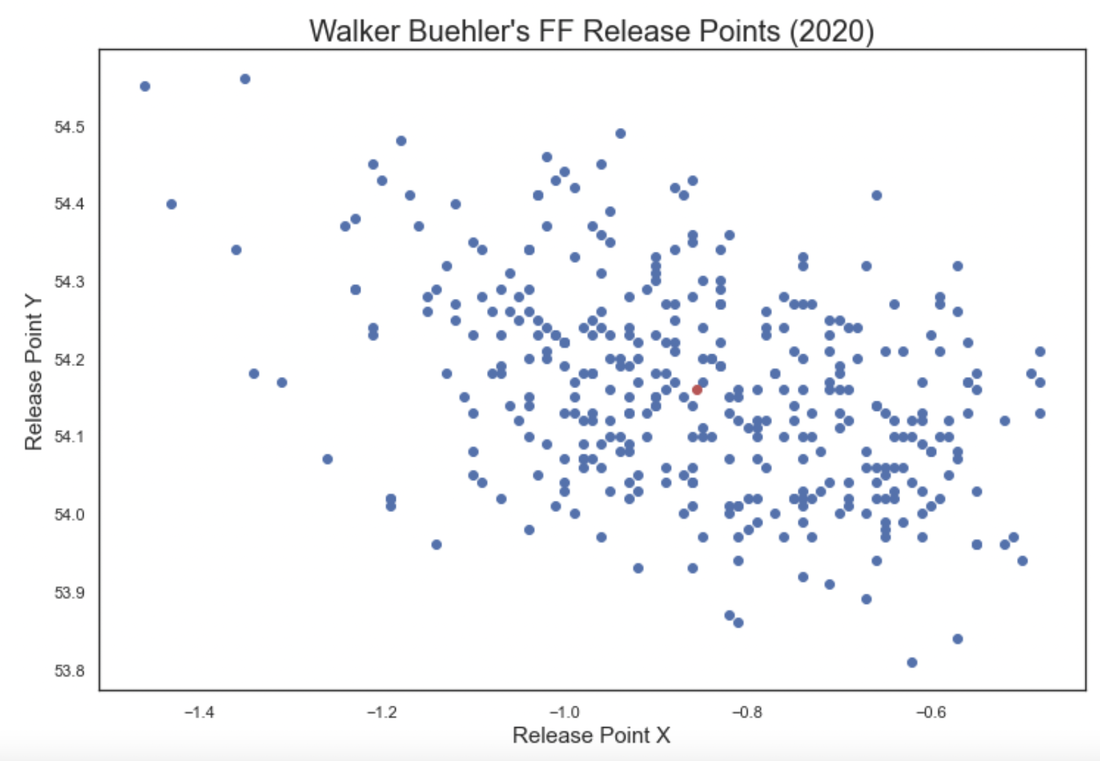 Next, I merged in 2020 season stats and looked at the correlations between this new metric(?) and more tangible, meaningful metrics. Results Here are the top 10 highest correlations with standard deviation of release point and the associated r-squared: 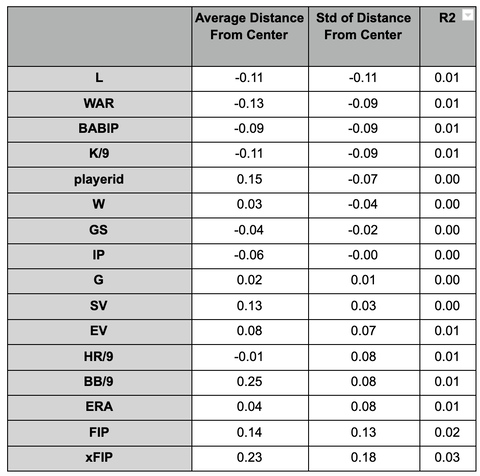 I was hoping to see a stronger correlation and r-squared between the standard deviation from center and control metrics like BB/9. Unfortunately, this feels like a dead end. But, before you totally write it off and close the tab, let’s look at pitchers who had the highest standard deviation from center to see who we’re talking about: 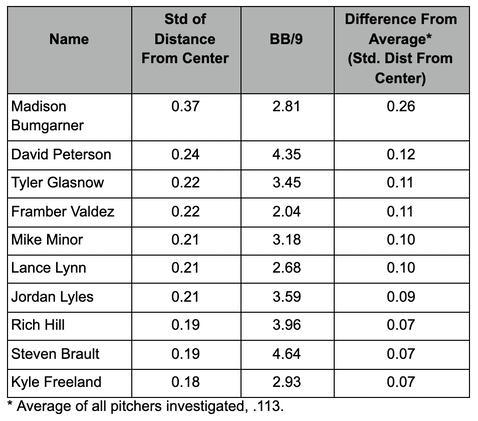 It’s an interesting list of pitchers, particularly the old vet Bumgarner. To be honest, I’m not sure what this means. The league average BB/9 in 2020 among starters was 3.17 and this list has below and above average pitchers though, again, my research does not show a correlation between BB/9 and the release point standard deviation from center. Interestingly, 6 out of 10 of these pitchers have higher than average BB/9 rates. It is interesting to see Glasnow on this list, given his command issues early in his career.
Conclusion In truth, you’re probably not going to make it to a major league start if your fastball release point map looks like a battleship game board. So, in comparison to launch angle tightness where there’s more margin, release point tightness should, theoretically, be very tight for starting pitchers. There is not enough evidence here to suggest that release point variability of the fastball is much of an indicator of success. As mentioned before, we shouldn’t expect these major league starters to show much variability in their release point. However, this feels like it could be useful in younger player development, especially as young players in high school and college start to develop their arms. Looking at bullpen session data on release point variability, where it is available, could be telling for pitching coaches. It’s hard to notice release point variability with the naked eye, and a high release point standard deviation from center could be useful for coaches to focus more on the mechanical efficiency of young players. Future Work It would be interesting to see if there are any correlations between release point standard deviation from center and injury. Could it be an indicator that there is something wrong with a player’s arm when he is not likely to admit it? If a pitcher is on the cusp of injury, or simply fatigued, and begins overcompensating, could their release point become more sporadic? If you have any thoughts on how release point variability could be useful, please submit a comment. If you are interested in seeing the python code that went into this calculation, please take a look at my GitHub. Thanks for reading! Ryan Mountcastle is a hitter who has always hit on his way up to the majors. He hits the ball hard, he puts it in play and he gets on base with his speed. Having a history of high BABIP seasons in the minors, Mountcastle repeated that history in 2020 with a sky high .398 BABIP. While we should expect him to keep hitting, we cannot expect this extraordinarily high BABIP to continue. In 2020, Mountcastle proved to be a free swinger, swinging above average inside and outside of the zone. Here's Mountcastle's 2020 swing profile and rankings (players with at least 100 PA's) along with league averages: 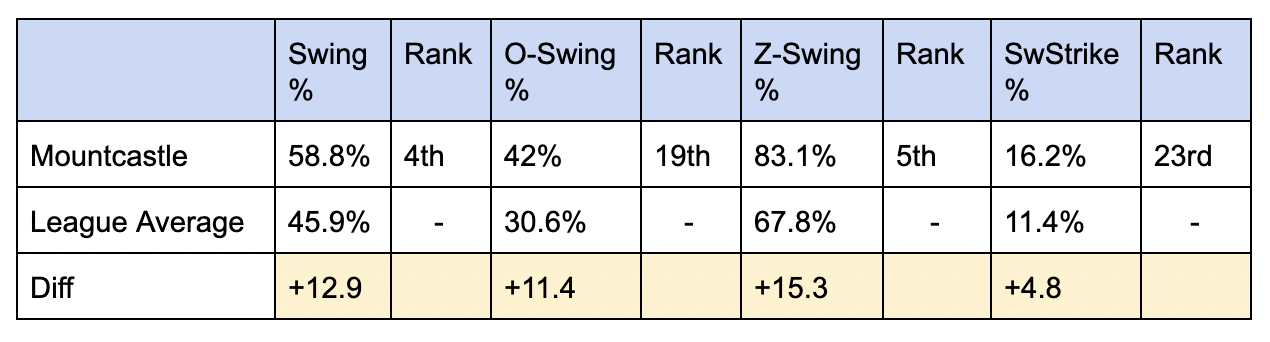 Let's take a look at how he does with making contact: 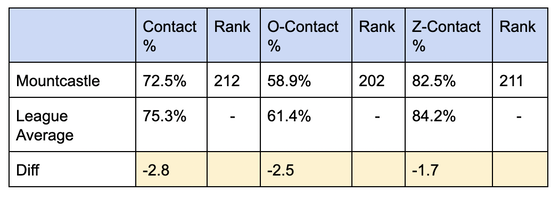 The young Oriole is over swinging with below average contact, but not too far below average. When he does make contact, he is in the 65th percentile in hard hit percentage. What about behind in the count vs. ahead in the count? 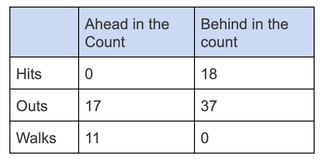 What is most interesting here is when Mountcastle does fall behind in the count, he can hit. It seems odd that he has no hits while being ahead in the count, but maybe this just means he becomes more patient. The opposite of this happens when he falls behind. All of this leads one piece of advice: Take the first pitch more often. Mountcastle took the first pitch 75 times in 2020, 50 balls and 25 strikes, putting him ahead in the count 2/3rd of the time. He's shown, with a small sample of course, that he can swing the bat and get on base when he's behind, but it won't be long until pitchers take advantage of his low contact rates and get him chasing when he falls behind. The batter being ahead in the count is better for the batter. Better for the batter...better for the batter...better for the batter...sorry. It seems logical that if he's not one to struggle when behind, he can gamble with the first pitch, swinging less and giving him potentially more time at the plate. One last image from Baseball Savant will show us Mountcastle's run value in swing/take situations (click here for better viewing): 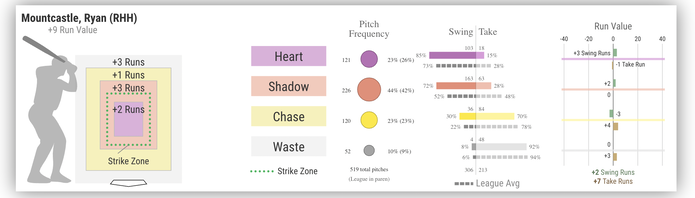 We see here that Mountcastle is producing more runs by taking than he is by swinging, For the most part, Mountcastle is hitting singles and often times, infield singles (18.6%). 32 of 42 of Mountcastle's 2020 season hits were singles that left him standing on 1st base. A walk will also leave him standing on first base. The point is, if there are no baserunners, a single and a walk are arguably the same thing. With only 11 walks (all coming from being ahead in the count) and a walk rate of 7.9%, Mountcastle could benefit from a little more patience. If he were to take the first pitch more often, it would put him in control and likely, lead to him standing on first.
Though it may seem silly to write an entire article ending with advice like, "Don't swing as much", sometimes it helps to be told what you already know. Swinging less in 2021 will give Mountcastle more looks, more opportunities to get on base and reinforce to management that he is a concrete part of the future.
Small sample sizes can be fun to look at, even if they have no real statistical significance. The 2020 season was short for MLB players and even shorter for minor league prospects. Dean Kremer was one of those players. He started 4 games, got a win, got a loss, accumulated a 4.38 ERA and threw 346 pitches. What does that tell you about his performance? Nothing. So what should we look at? One fun thing is to see what a pitcher did when they were feeling good, ahead in the count. Here is a look at all of Dean Kremer's pitches when ahead in the count in 2020.
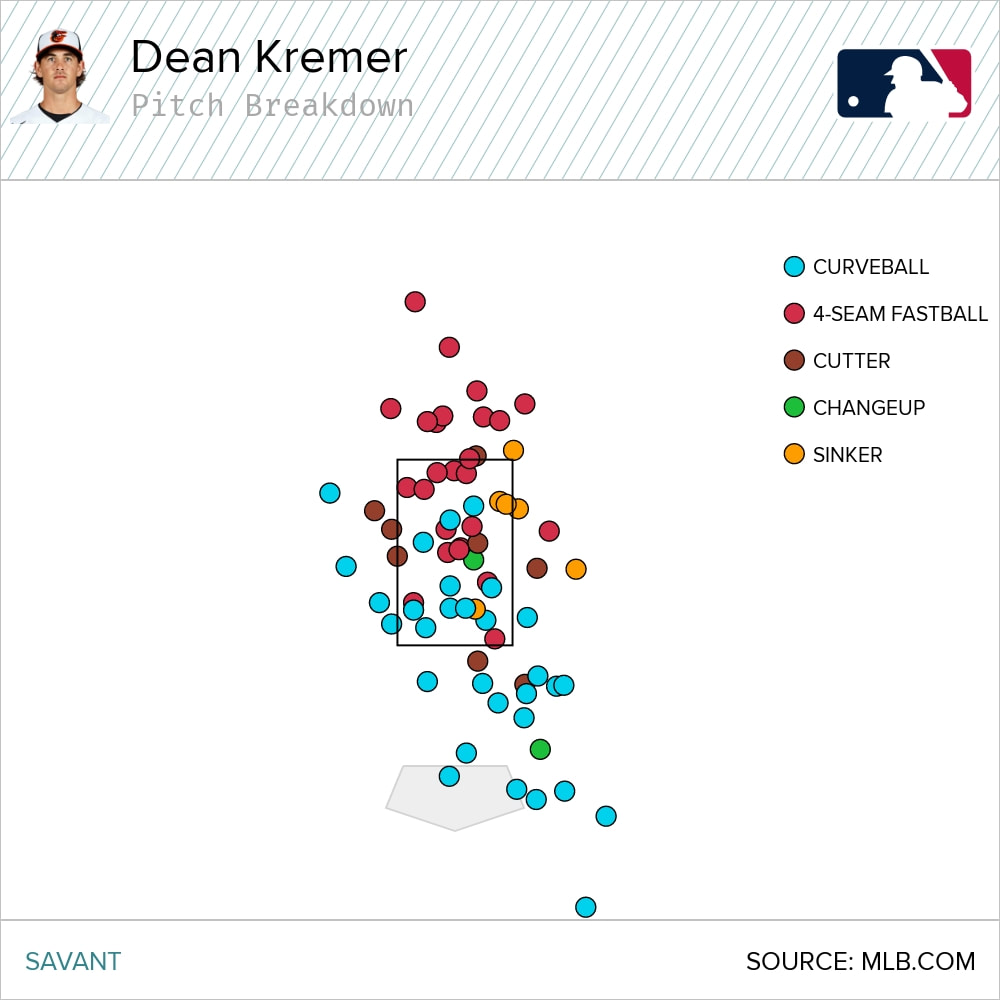
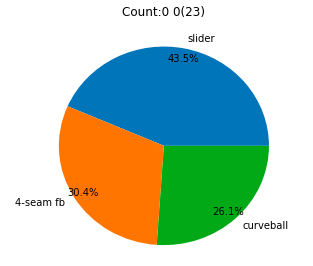
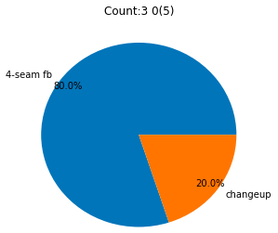
Kremer went ahead in the count 71 times (20.5%). For comparison, Cy Young Award winner Trevor Bauer was ahead in the count 29.2% of the time in 2020. Kremer threw a curveball in 30 of those count situations or 42%. 5 times did he strike out batters with that curveball and all 5 of them were swinging strikes. Here's a look:
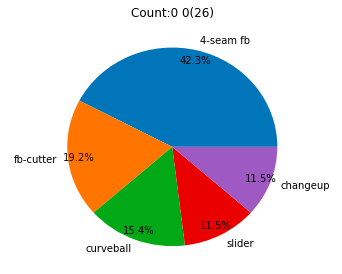
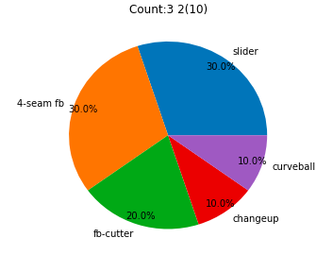
5 times is nice, but that doesn't tell us anything. Good pitchers can get hitters to chase the curveball, no doubt. The question then, is just how weird does his curveball look to batters? Yes, it has to look weird. It has to look so weird that the hitter is still thinking about how weird it looked when the next pitch is coming at them. Statcast's pitch movement measurements can help us non-player keyboard pluckers better understand weirdness. According to pitch movement measurements on FanGraphs, Kremer's vertical movement was -10.6. Again, for comparison, Bauer's curveball vertical movement was -13.0, which was third on the list of all MLB pitchers who pitched as little as 10 innings in 2020. That's a pretty damn good curveball from a young pitcher. Here's how that curveball movement compared across the league in 2020:
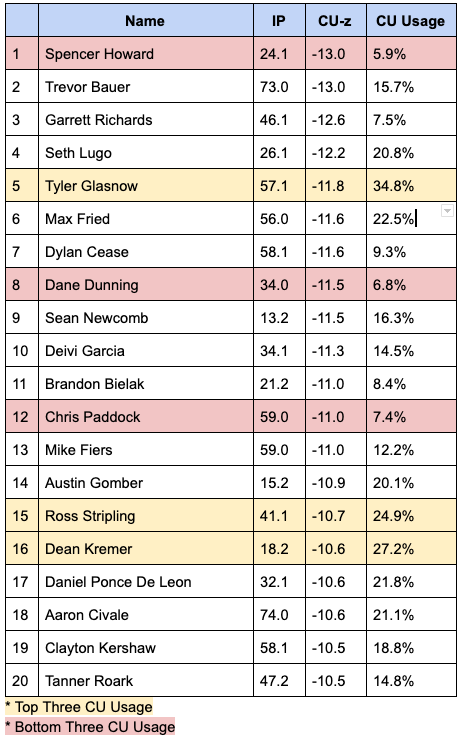
We can see from this list (anytime a pitcher finds themself on a list with Kershaw is good in my opinion) that Kremer is in good company. Somewhat troubling though is Kremer's usage where he ranks 2nd behind only Tyler Glassnow. So what can we recommend when a pitcher has an excellent looking curveball? Throw it more, Lance McCuller's Jr. style? Or through it less? It could be more like through it less in 2 strike counts and finish them off with more of this....
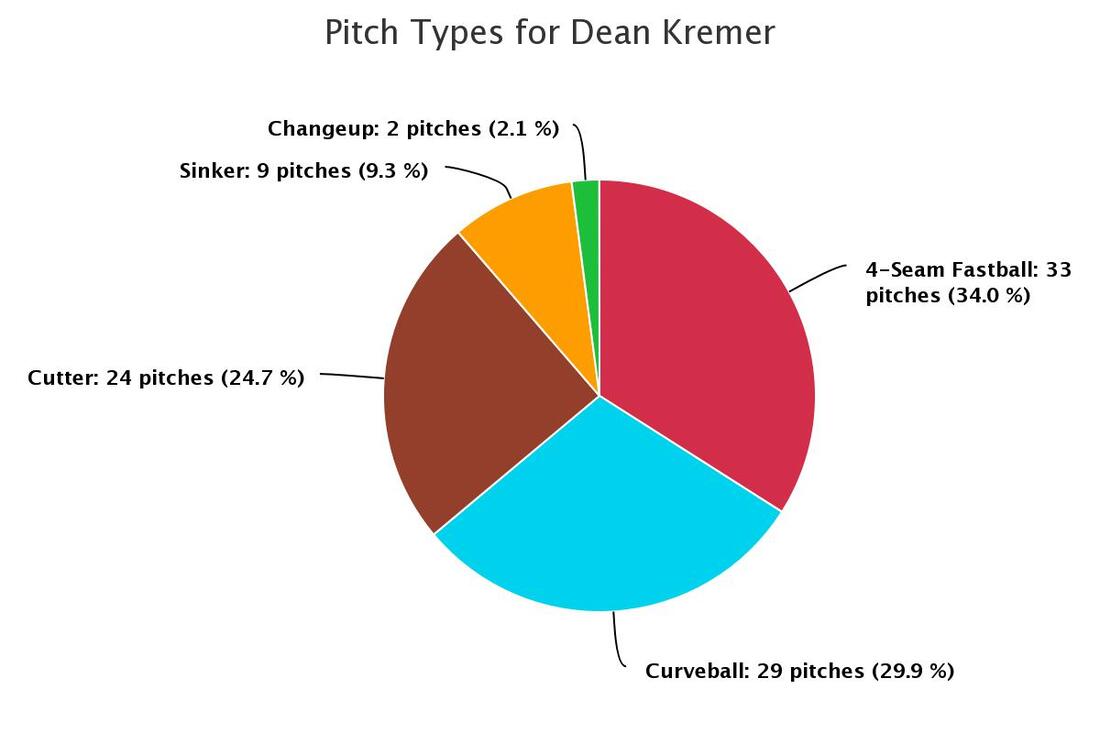
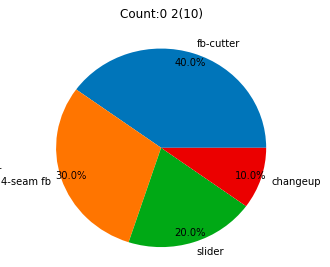
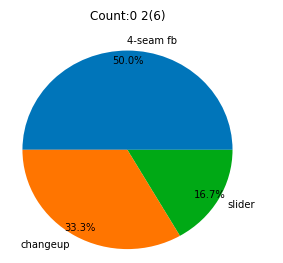
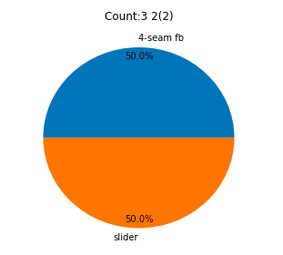
Using the 4-Seam/Cutter/Sinker more often after a swing and miss on the curveball has proven to be effective in a small amount of time for Kremer. Set them up with the curveball then finish them off with the fastball. The pie chart below shows pitch types on 2 strike counts. Kremer is trying to put hitters away with that curveball, maybe a little too much. He has showcased some real impressive movement with the curve, leaving hitters dismayed. If he tries to finish them off with the hard stuff while they're still trying to shake off the confusion of the curve, 2021 could be a great year for Kremer.
Baseball jobs are hard to come by. Interviewers ask, "Why do you want to work for an MLB team?"....I like baseball a lot and want to do more baseball. I may not work for an MLB baseball team, but....I like baseball a lot and still want to do more baseball. Here in this series, I'll focus on 1 major league team in each installment and I'll pretend I'm a baseball analyst. Not a GM, not the manager, not the third base coach, not a former player, a real, nerdy, non-player analyst, lurking in the basement office preparing some kind of weird analysis and hoping to latch on the person just a rung above me to present my analysis in hopes of it reaching the next rung. It can be fun to pretend!
In this series I'll try to:
As team's analytical departments continue to grow, so does the public access to baseball data. There aren't many secrets anymore. But, there's plenty to write about. Plenty to point out. Plenty of toys to pretend with. So, here goes.
My stay-at-home, baseball-postponed, zoom-meeting-filled days have, I'll admit, had a little background noise. Thanks to the MLB unlocking a ton of classic baseball games, any starved for baseball fans have been gifted historical visuals of infield/outfield green grass and are even being given the luxury of being able to pause for snacks/bathroom breaks.
I had the pleasure of watching the 1952 World Series between the Jackie Robinson rostered Brooklyn Dodgers and the Mickey Mantle present New York Yankees. What a different looking game that was. Every man in the stands is wearing a suit and smoking a cigar and hit-and-run bunts make up about 25% of all swings. Another game I re-watched was the 2016 World Series Game 7 won by the Chicago Cubs. Who could forget such an amazing game? A re-watch is highly recommended. If you want to be real nerdy about it, I suggest reading (or re-reading) the final three chapters of Tom Verducci's, The Cub's Way after you watch. This little trip down memory road made me curious about the 2 strike bunt. In the top of the 9th with the game tied, Joe Maddon gives the sign for a bunt. When relayed to Baez from third base, he is confused and needs to call time in order to talk it over with the third base coach. Verducci quotes Maddon as saying, "The other thing with the two-strike bunt most people don't understand is that most guys - their two strike batting average is abysmal. It's beyond abysmal against certain pitchers. It's nonexistent. I would like for some of our guys to do that with two strikes once in a while. Lester won a game with a two-strike safety squeeze. Lester's the best bunter on the team." Here was Baez's batting line in the 2016 playoffs with two strikes when he swung, and when he bunted. 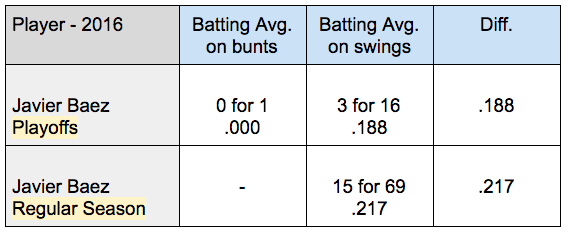
The truth is, he didn't bunt in the regular season with two strikes on. I mean, who does? That's kind of crazy. A batting average of .188 with two strikes on during the playoffs is not great and it was, just like ol' Joe said, worse against right-handed pitching with Baez going 0 for 9 against righties in the playoffs. That is exactly what he was facing against Bryan Shaw a righty. So, trying to lay down that bunt was probably a good idea, nice work Joe. Unfortunately, Baez bunted foul and struck out. But, that's the risk associated with the 2-strike bunt.
I wanted to see when something like this happened most recently and here it is!
It just so happened to come against the Cubs in the 2019 season. Orlando Arcia effectively moved Yasmani Grandal from 1st to 2nd and after 2 fouled bunt attempts! The third times the charm, but in the end, it took a Keston Hiura walk off home run in the 10th to secure the victory for the Brewers.
I'm hungry for more. For those hitters who had multiple 2-strike opportunities to either swing or bunt, what were the splits? In other words, what hitters bunted and swung in different occasions when the go-ahead run was on base and they had 2 strikes on? 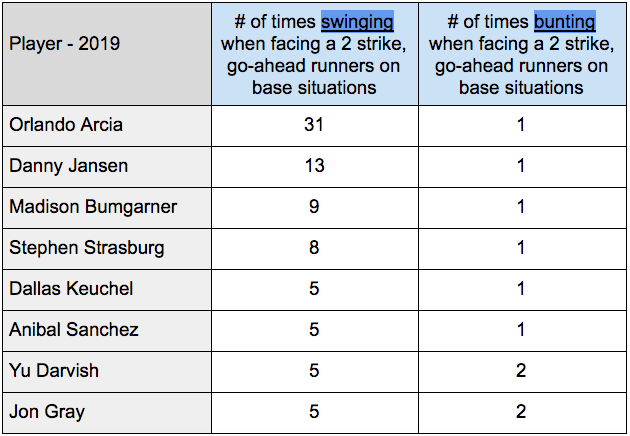
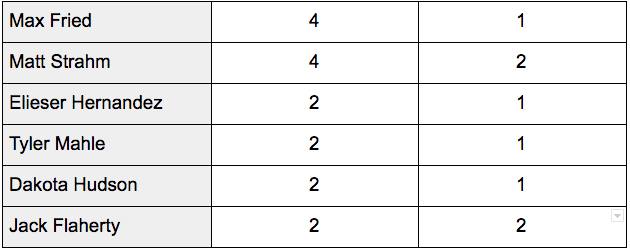
Only 2 of these players are non-pitchers and have enough 2-strike swinging attempts to make any comparisons. This is where things really comes together! If we only look at these two positional players and how they did when they had:
Here's what we see: 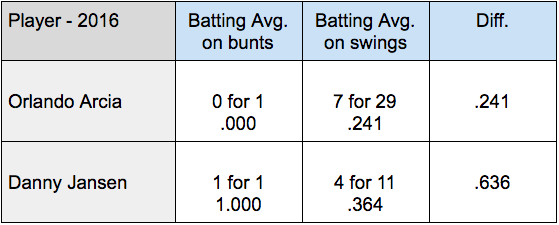
They call it a sacrifice for a reason. In reality, looking at batting average means much less than looking to see if the runner eventually scored as a result of these bunts. However, magic can happen and in the case of Danny Jansen laying down a 2 strike bunt and scoring the go-ahead run in extra innings, it did. Jansen also has some serious success when the go-ahead is on base. Could this be some kind of super special clutch hitter here? Maybe...maybe noise, but either way it proves that the 2 strike, sac-bunt with runners on can work!
For all code and technical work, please see my notebook on my GitHub page.
It is amazing to think that pitchers can be so good as to choose whether or not they want to make the hitter put the ball on the ground or just strike them out completely. Well, ok, it's not that simple. But the truth is that there are a lot of pitchers who think, "I'm striking this guy out." Or something like, "He can't put the ball over the wall if he can't hit it." But, there's also plenty of pitchers that can't strike out the guy at the plate and resort to letting their infielders put him out. As the battle of launch angle vs. pitch type continues to rage on, I was curious as to what actually makes the difference between those strike out pitchers and those who put the ball into play and specifically on the ground in hopes of getting the out. First, I started with fangraphs (all the data used in this analysis is Fangraphs) data from showing 2017 - 2019 season stats. Then, I sorted to find which qualified pitchers have shown up as top 50 K/9 pitchers in all three seasons. They were: 1. Max Scherzer 2. Jacob deGrom 3. Trevor Bauer Then, I did the same, but rather than K/9 pitchers, I wanted to see who has consistently been a ground ball heavy pitcher between 2017 - 2019. Who was in the top 50 each of the three seasons? 1. Aaron Nola 2. Patrick Corbin 3. Sonny Gray Remember, I'm looking for consistency from 2017 - 2019 so Stroman being omitted from this list is for that reason, but don't worry, he'll come up later. For simplicity, I chose the top 2 in each category. The graph below compares K/9 among these 4 pitchers. Besides the 2018 season when Nola had such an excellent year, Scherzer and deGrom are well ahead with Scherzer steady above 12! That's crazy.  Now, you would think that pitchers who are not even allowing guys on base would have lower ERA and FIP totals. As you can see below, that holds up. Ground ballers are simply allowing the hitter a higher probability of getting on base than those pitchers who simply won't even let you even hit the ball. That makes sense. This is not groundbreaking work. Again, notice Nola's ERA in his great 2018 season? And it appears Corbin had a good defense behind him helping bring down his ERA despite a higher FIP. 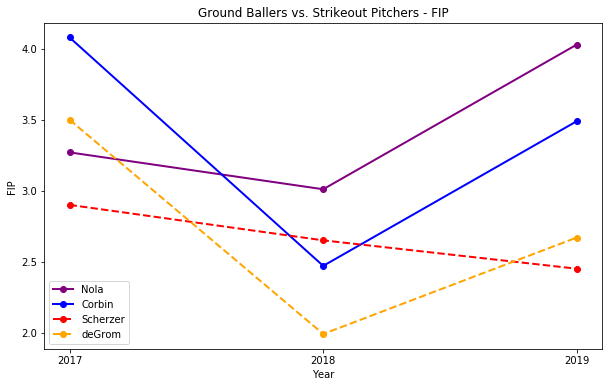 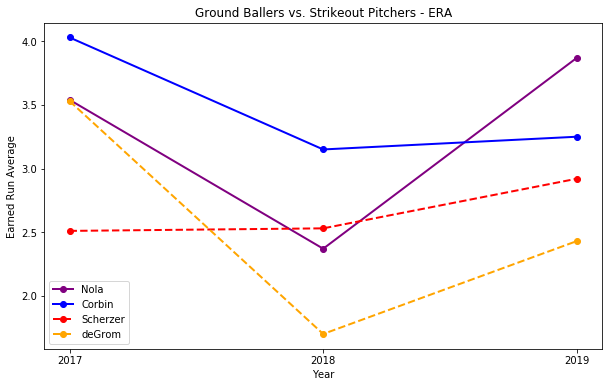 Another way to look at the comparisons between ground ballers and strikeout pitchers is to notice their pitch arsenal. Scherzer is clearly an "overpower you" kind of hurler, whereas Corbin relies heavily on the slider. Other than Scherzer throwing a cutter and deGrom throwing a sinker, both of their profiles look very similar. This can also be seen in Nola and Corbin's ability to keep a batter honest with Nola throwing way more curveballs than everyone else and Corbin throwing the slider more than anyone else. 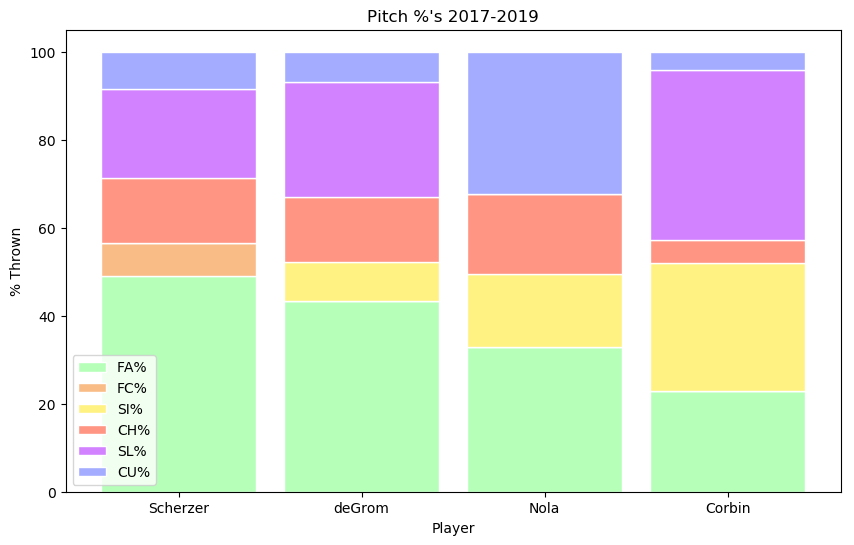 What about a rotation where this really matters? Just focusing on one team that plays in Colorado...they're named the Rockies...we can see that it's not as clear. You would think that in a place like Coors Field, these guys would be doing everything they can to put the ball on the ground. As you'll see in the next graph, their doing a decent job. 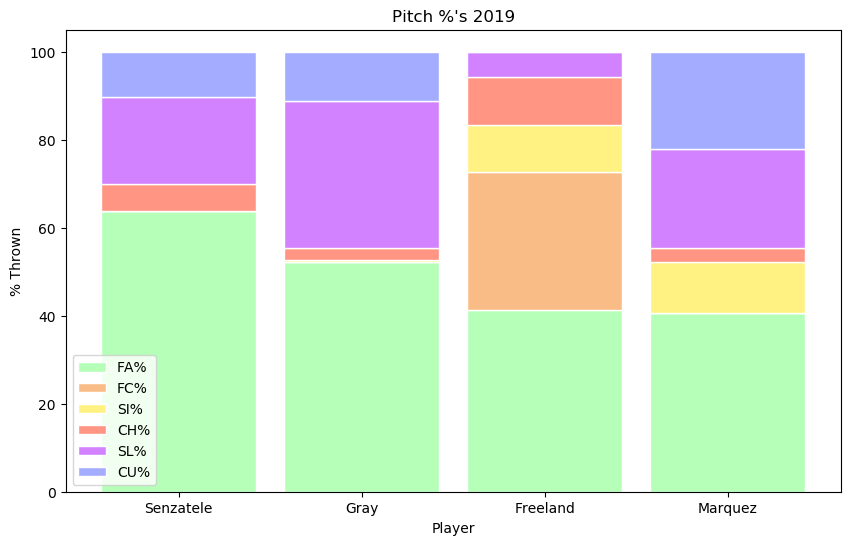 Now, it gets confusing. Below, you'll see that Senzatele is the Rockie pitcher who forces the most ground balls, nearly as much as the ground ball king, Marcus Stroman and well above league average. But, with only 124 innings pitched, it may not be the best sample. Clearly Senzatele pitched like a groundballer in Colorado in 2019, but his arsenal looks similar to Scherzer's. However, his K/9 (5.49), BABIP (.333) and ERA (6.71) were all way too high to make him effective. So yes, he was a ground ball pitcher in only 124 innings last season, but did it help his team win? 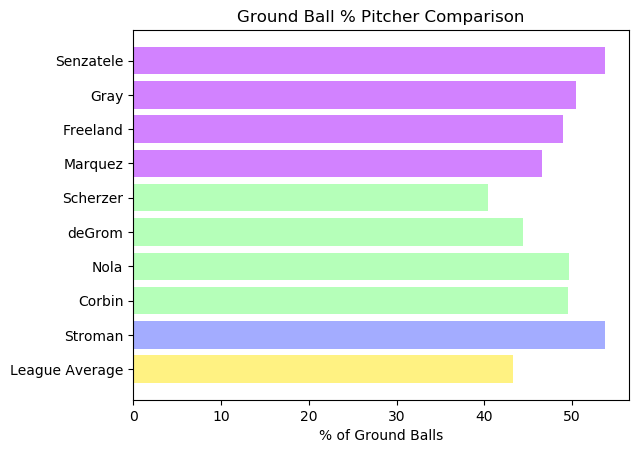 So, what is a ground ball pitcher? Well....I'm still not sure. It could be, in the case of Senzatele, noise. Give him a few more seasons and we'll see if what he's doing is groundball pitcher worthy. Is Stroman a groundball pitcher? Almost everyone would say yes. But, what about deGrom? He was above league average in 2019 and he throws a sinker. In the end, this analysis is only as effective as the pitchers we are making comparisons between. What is clear, however, is that pitchers who effectively force a ground ball more than others are throwing a number of different pitches with movement and typically a sinker is one of those pitches. Creating groundballs may not translate to success, but in a place like Colorado, it may be necessary and Rockies pitchers are doing it above league average.
This time last year, the talks on Keuchel were much different. No front office was really budging on giving what Keuchel was asking for. Going back to December 28th, 2018, Steve Adams reported that Keuchel was looking for a five-year deal when, at the time, MLB Trade Rumors was predicting a four-year deal at $82M. But no one was biting. Not the Nationals, nor the Reds, not the Phillies or the Brewers. Every week it seemed like there was a new team being rumored to have spoken with Keuchel’s camp, but no deals were made. Needless to say, this offseason has been very different for Keuchel and just about every other player on the market. Once the 2019 trade deadline passed and Keuchel was no-longer carrying a dark cloud of draft pick compensation with him, teams pounced. Finally being acquired by the Atlanta Braves on June 7th, the news made a few fantasy baseball owners quiver with excitement. The Braves signed Keuchel for a 1-year, even though it was more like a half a year, deal at $13M. Now, we can look back and see how he did after all the rumors and contracts and headlines and hopes and dreams of fans just waiting for their front offices to make the announcement that they finally added a much needed arm. When Braves fans celebrated on June 6th, their team sat at 36-26, just a half a game behind the Washington Nationals. Finishing the year at 97-65 with a first place finish in the NL-East makes it sound like the addition of Keuchel was a good one. So, why let him go? It would be hard to measure Keuchel’s impact on a young Braves rotation in just half of a season. But, without diving too much into statistics, you would like to think that a veteran pitcher joining a young and talented rotation would help. If anything, Keuchel helped alleviate some of the fast growing innings accumulated by the young group. 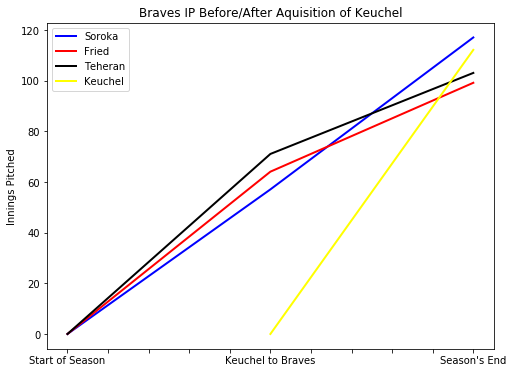 With only half a season, Keuchel soaked up 112.2 innings with a 7.72 K/9 ratio and an ERA of 3.75. But, considering the ups and downs of Mike Foltynewicz, the Braves were lucky to add an arm that finished with a sub 4.00 ERA. Here are the stat lines from Baseball-Reference.com for these four pitchers: Though Keuchel didn’t perform the way us quivering fantasy owners might have thought, a Dallas move to Chicago really makes great sense for the White Sox, now showing that they are ready to win. Here are the ones that jump out to me: 1. Keuchel and Grandal: The potential for a great relationship Great reporting over at FanGraphs.com by Tony Wolfe shows just how important Grandal’s pitch framing abilities may be to an in-the-zone type of player like Keuchel. Getting the calls on those border-line pitches may a difference maker when pitching in Chicago. 2. White Sox Defensive and Keuchel the Groundballer Keuchel finished the year with a ground ball percentage of 60.1. That’s first in the major leagues among pitchers with at least 100 IP. Though the White Sox defensive metrics don’t jump off the page (bottom 10 for most team fielding statistics) they did perform the best in the league at FanGraph’s double play runs saved between, mostly, Tim Anderson and Danny Mendick. If the White Sox can tighten up the defense and utilize the infield shift effectively, Keuchel’s speciality of putting the ball on the ground should translate to wins, though that might be a big ask. However, don’t forget how good of a field Keuchel is himself. If you’re going to put the ball on the ground, you should be able to field it. Among pitcher’s with at least 100 IP, Keuchel finished 2nd in DRS (Defensive Runs Saved) with 5. 3. Keuchel as the Old Vet It would be too hard to measure whether or not Keuchel has any influence on young pitchers. But looking at WAR of young starting Braves pitchers before and after Keuchel’s addition to the Braves shows that he simply didn’t hurt anyone. Both Soroka and Fried continued to add value to their team. It would be so interesting to see how these numbers shaped out, had Keuchel joined the Braves at the start of the season, but then again, there might not be so many headlines and stuff to write about had that been the case. 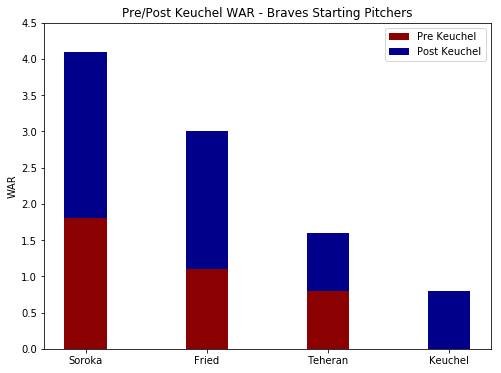 For now, the Chicago White Sox look to improve on their 72-89 record in 2020 and us fans will be watching to see the influence Keuchel actually has on another young rotation. Giolito, Lopez and now Gonzalez and Keuchel throwing to Grandal? White Sox fans have a lot to be excited about.
Once October goes by and the cold winds of November and December start to blow, the nearest memories us baseball types have to look back on are the games (all 7 if we were lucky) of the most recent World Series. It really should be something that is celebrated more. Too many analysts and writers seem to jump straight to new free agents and their top 5 most likely landing spots. Preseason predictions are made way too soon. Next year's probable top prospects are already being talked up. But, while I am appreciative for all of those writer's giving us great articles to read and help to get us through, I want to pump the brakes a bit and focus on the 2019 World Series. It was a doozy!
The story of Max Scherzer's arm injury just could not have been more dramatic. Here is a guy that everyone knows as a fierce competitor, tough as nails and one who eats playoff pressure for breakfast, and he can't even put on a t-shirt by himself the day he is to take the mound?
As fun as it was to watch Max pace around in the dugout on his nights off, fans need to see the ace on the mound. Miraculously, we were able to see the Nationals ace take the mound in game 7. Big shout out to cortisone shots! But, Max's Game 7 performance had everyone on their toes. Knowing there was injury, knowing there was fatigue, knowing the pressure was turned way up, how much do pitcher's change their approach between starts in high pressure games like these? Let's take a look at how Max Game 1 compared to Max Game 7. Let's see if there was any significant difference in how he approached the game.
Pitch Type
Here's the element of the game that made me think the most. How much are pitcher's playing chess in their mind when it comes to pitch selection? Did Scherzer prepare a diverse array of first pitches to keep batters on their toes? If he fell behind in the count, was he going, no question, straight fastball? What about when he was ahead?
Here's a significant change right from the start. Facing 23 batters in Game 1 and 26 batters in Game 7, Scherzer made his first pitch fairly unpredictable. Most likely to see a slider or a 4-seam fastball in Game 1, but certainly more unpredictable in Game 7.
How about when he's ahead? With a pitcher's count, Max relied on the fastball in game 1 and game 2. Get ready to see some heat when you're down in the count.
What about when Scherzer fell into trouble? Well, he didn't in Game 1. In Game 7 however, things were looking shaky 5 times. Ol' reliable helped him through these sticky situations.
Finally, making himself most unpredictable, batters didn't know what was coming in a full count in Game 1. Only facing a full count twice in Game 7, Scherzer through out a 50/50.
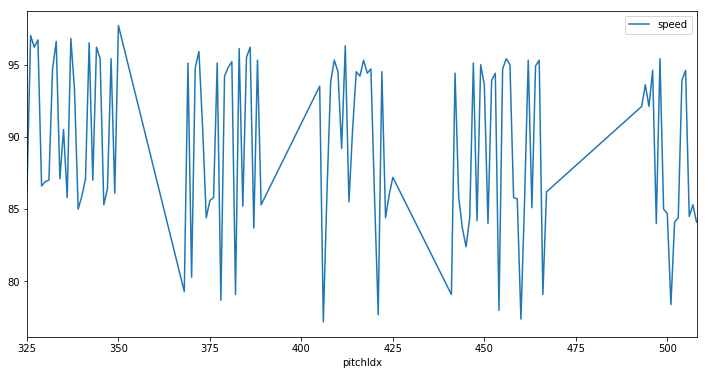
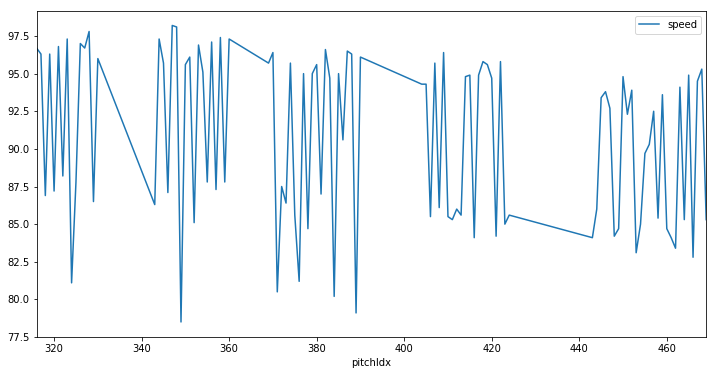
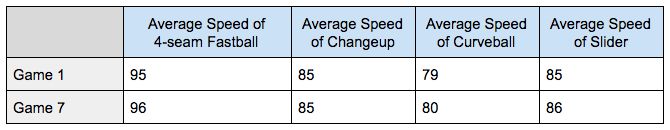
Speed
Adrenaline, injury, pressure, fatigue, determination and perseverance. How do these things play into Scherzer's speed change between Game 1 and Game 7? Not much.
Game 1
Game 7
Performance Metrics
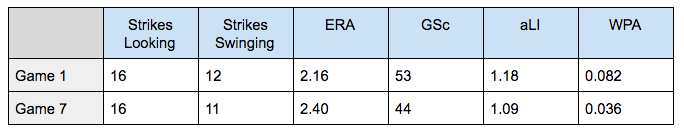
GSc - Bill James' Game Score Statistic
aLI - Average Leverage Index WPA - Win Probability Added Again, it looks like Scherzer was Scherzer. Nearly identical in swinging and looking strikes, Max delivered a total of 10 strikeouts between these two outings. By looking at his game score, average leverage index and winning probability we can see that Game 1 was a better performance.
It appears that the old cliche of "It's just another game..." and "My approach is the same..." rings true. With hurt arm and all, Scherzer came out and performed like an ace for one last time in 2019. He more than deserves to celebrate all offseason long. As the 2019 World Series Champion Nationals continue to do so, let's just remind ourselves that we don't have to constantly be on the cusp of breaking news and that going back and looking at the details of a great World Series can be just as satisfying as a free agent signing with a new team.
|
AuthorThis blog is dedicated to baseball analytics and general baseball discussion. Archives
January 2021
Categories |
 RSS Feed
