|
Knowing what is happening under the hood of different types of algorithms is important. I was once asked in an interview to explain a project that I had worked on and I decided to talk about my favorite portfolio project that tested a variety of algorithms to predict the likelihood of an MLB baseball player receiving the Gold Glove Award at the end of the season based on their season defensive metrics. I was happy with the way I explained my project and how in the end, an AdaBoost classifier was the best algorithm for my model. My interviewer nodded, expressed his intrigue and then, asked me to break down what the AdaBoost model does and how it works under the hood.......
Que stumbling, rambling, vocalized proof that I don't actually know the real details but I know it's better and uses like....more trees???....or something like that??? Before an interview you prepare and study and practice and talk to yourself in the mirror and there's always a question that will come up that you are unprepared for. So, I took notes on what I missed, hit the books to study up on the question I got wrong and here is how I would explain it if I could go back in time. I hope this helps you prepare for better explaining the details behind various ML algorithms. First, let's cover the difference between strong learners and weak learners. A weak learner is any model that does, just, good. It is predictive and it does better than random chance, slightly better that is. It can really be any kind of model or algorithm, but for the purpose of this exercise, think of it as a simple, shallow, non-tuned, vanilla decision tree. Now, think of strong learners as more than just that one simple, shallow, non-tuned, vanilla decision tree. Think of a strong learner as a random forest. Whereas before, we only had 1 tree, now we have multiple trees, each learning from a random subset of your overall training data (a technique called bagging) and each tree trains itself enough to make the forest model a strong learner, predicting better than random guessing. Weak Learners: Simple models that do only slightly better than random chance. Strong Learners: Models with the goal of doing as well as possible on the classification or regression task they are given. Examples include ensembles like random forests and boosters, A boosting algorithm is similar to that of a random forest because it ensembles trees together. First, a boosting algorithm will train a simple weak learner. It then evaluates which examples the weak learner got wrong and builds another weak learner that focuses on only the areas that the original got wrong. It continues doing this, building an overall strong learning model by iterating and building a more predictive and better trained or 'boosted' tree. Think of it as the algorithm looking back to see what went wrong, and giving the decision tree a little boost in the right direction. In the image below, you can see that the plus and minus signs change at every iteration. The first iteration is a very weak learner and at every iteration, the learner gets stronger. As the pluses and minuses are guessed right and wrong, their weights decrease and increase respectively. In the end, boosting has created a strong, predictive learner by starting with the a weak learner. It's a good old fashion strength boost! 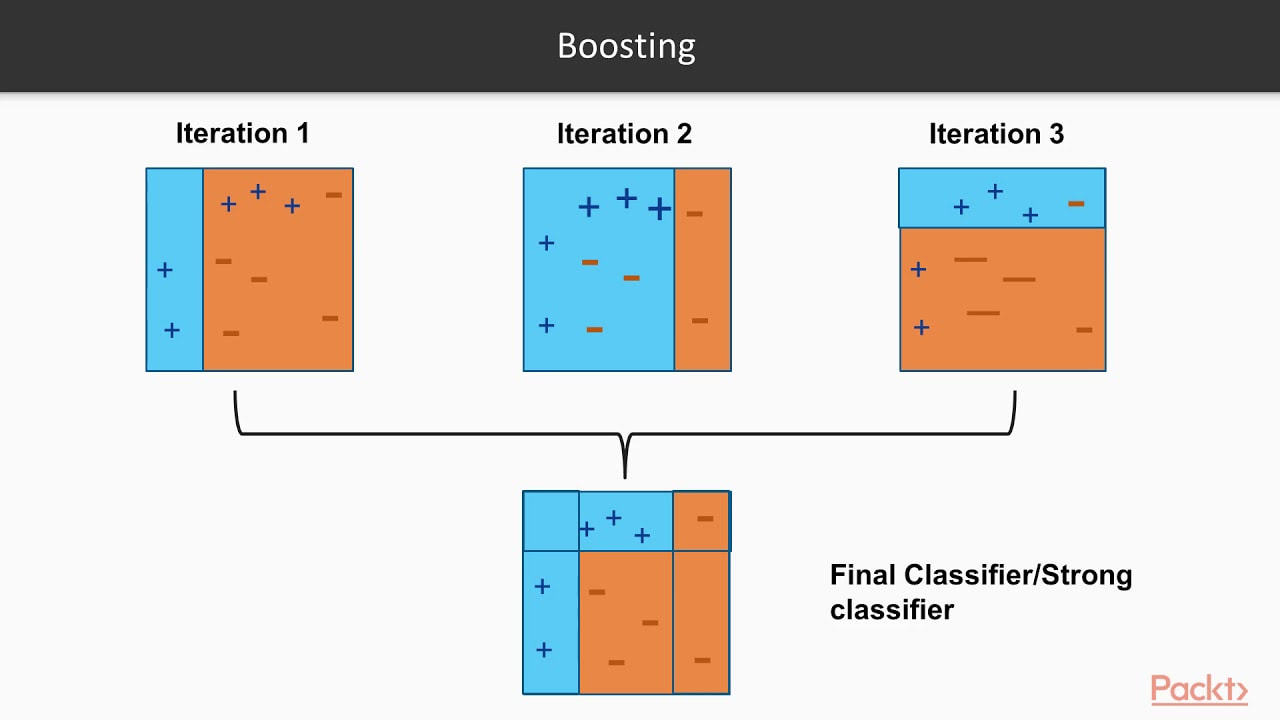
Image taken from a great video by Packt> : https://www.youtube.com/watch?v=BoGNyWW9-mE
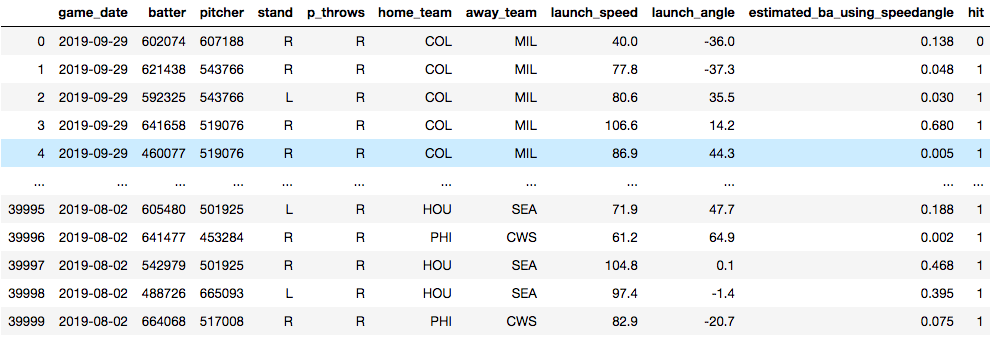
Now, time for an example. Below, you see a data set that I am using to train a model to predict whether or not a baseball player will get a hit. The model is trained on things like who the pitcher was, who the hitter was, how hard the ball was hit and at what angle the ball was struck. Essentially, I'm training a model in hopes that I'll later be able to predict what hitters will get hits against what pitchers. The data will need some tweaking to be sure, but for now, it's useful for this demonstration.
Vanilla Decision Tree
Training Accuracy: 100.0% Test Accuracy: 73.9% ------------------------------------------------------ Random Forest: Training Accuracy: 99.02% Test Accuracy: 79.11% ------------------------------------------------------ Adaboost: Training Accuracy: 80.13% Test Accuracy: 80.24% ------------------------------------------------------ In the end, we have some serious overfitting happening in the training of both the vanilla decision tree and the random forest, but we can see that the Adaptive Boosting model shows the best accuracy. An important point to note is the operational cost of boosting models. They take a lot of time. Training tree and tree and slowly making it just a little bit better each time will make for a long training time. Certainly there is a lot to dive into when it comes to evaluating a model, but I'll end it here. Try it out with your own datasets and see what results you can get.
0 Comments
As a recent graduate of the Flatiron School's Data Science Program seeking my first real job as a data scientist, I'm full of questions about what day 1 on the job will look like. I've been a teacher for the past 8 years and I know what day 1 of school always looks like. But as a career changer actively applying to jobs, I'm entering new territory. Yes, I've worked on a lot of great projects, yes I'm confident I can make models, clean data, create engaging visualizations and present my findings to stakeholders. But, like, how do I actually get the data I need to work with on day 1? You may be just like me and wondering the same thing. Chances are very high your boss or manager at your new data science job won't send you a Kaggle link and tell you to download a nice, clean and structured .csv file. But, I have a feeling you already knew that. Here, I'll break down all the ways in which businesses and organizations gather data and those words you'll need to know when your given new responsibilities at your new job. Gathered Raw Data Data is the most important aspect of a data science project. That statement seems a little redundant doesn't it? But, people often forget the quality of a project or found insight is only as good as the data it comes from. That will often depend on where the data comes from. Here are the two ways in which data can be gathered. Captured data Gathered from direct measurement or observation, captured data is commonly found through surveying or experimentation. This is typically data that has intentionally been collected. Healthcare data such as blood-glucose levels can be accumulated through captured data from medical reports or readers for a specific study. But the data doesn't stop there, think of all the other data points that would be collected if we were intentionally capturing blood glucose levels. Exhaust data The extra data that is given off when intentionally capturing certain data points is known as exhaust data. These 'extra emissions' have been found, at times, to be more informative than the captured data. An example of exhaust data in our blood glucose levels data would be the age, the diet, the socioeconomic standing or smoker/non-smoker standing of the patient. A key to unveiling interesting findings is in the researchers ability to find the important exhaust data and put it to use. Practice Can you think of an example of exhaust data in the following places? - social media - bank statements - electric scooters  Knowing the importance of exhaust data is critical to drawing informative insights from captured data. Structured vs. Unstructured Data Now, that you know what kind of data you have and how it was acquired, it's time to clean it all up and turn it into a workable format. In a perfect world, we would all be working with structured data everyday. It would clean, labeled, sorted into nice rows and columns and would be found in relational databases or spreadsheets that would just need a SQL query or a pandas .merge() to prepare it. But, typically data comes in unstructured and sloppy. This would be like if a company were collecting loads of exhaust data and were unsure how they would use it, but collected it anyways. This brings up the question of how that data is then accessed by you, the data scientist, or stored by the company. Data Lake vs. Data Warehouse Raw unstructured data goes into a lake when it is being collected for no specific reason. This would commonly involve the collection of exhaust data. A data warehouse has more structure, more reasoning behind storing and organizing data. 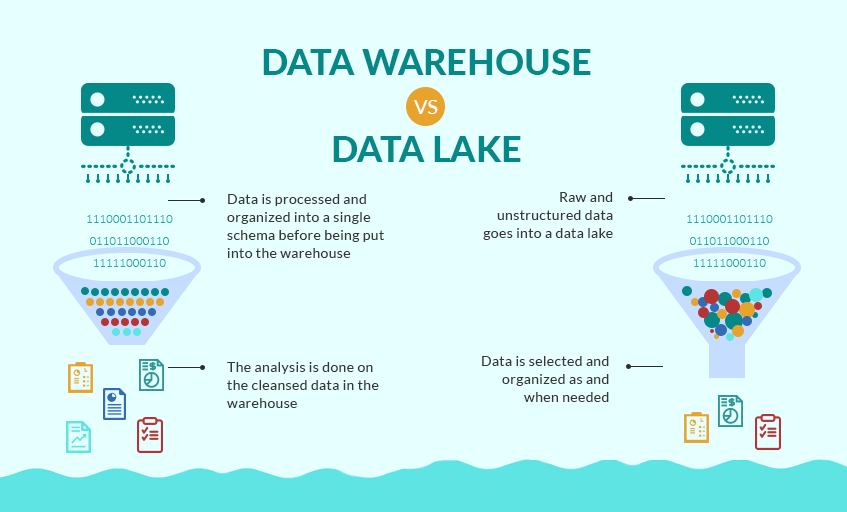 Source: Grazziti Supervised vs. Unsupervised Learning Finally, we get to talk a bit about modeling. Many data scientists would tell you that modeling is about 10% of their overall work. Let's put the details of this post all together with two examples. Example 1: You've downloaded a nice, clean .csv type and want to model with it. Q#1. This data is most likely what type: a.) structured data or b.) unstructured data? Q#2. This data is most likely held in a: a.) data lake or b.) data warehouse  Source: SEMrush Answers:
a.) structured data b.) data warehouse Nice work. This data has been collected and stored in a certain area for a certain reason and will most likely be structured data accessed through a relational database, perhaps using SQL querying. So, now all you will be able to model using supervised learning. You may created a training data set and a testing data set and you can created target variables where your ML model can learn from the training and apply what it has learned from the training to a test set. Example 2: This one is a little more difficult. You have someone at work come to you and ask you a specific question to analyze. Now, you have to figure out what data you will work with, where to get it and how to clean it and structure it for analysis or modeling. You will now diving down into the data lake and pulling out unstructured data, maybe exhaust data. So, how do you model with unstructured data? Instead of classification or regression, you now are trying to learn about the input variables and the structure in which the data flows in. For example, you could be utilizing K-means clustering or association learning. Once you learn more about your dataset and how it could be structured, you can move onto drawing insights. Hopefully this run-down of data types and structures will make you feel more confident going into the office on day 1. Don't be afraid to ask questions, don't be afraid to open up your notes and if your colleagues use a bunch of acronyms and words you don't know, write them down without them looking and google it. You'll be just fine. References: Structured vs. Unstructured data https://learn.g2.com/structured-vs-unstructured-data Supervised vs. Unsupervised https://machinelearningmastery.com/supervised-and-unsupervised-machine-learning-algorithms/ Data Lakes https://en.wikipedia.org/wiki/Data_lake https://searchaws.techtarget.com/definition/data-lake |
 RSS Feed
