|
Bokeh is another great visualization that has a few advantages in certain situations over Matplotlib and Seaborn. Bokeh generates interactive, html ready visualizations that can be embedded directly into a website. Here, I''ll show you step by step how to take a data set and generate these interactive visualizations. For this tutorial, I looked at baseball data from the 2018 season to see which of the 6 divisions MLB teams are separated into hit the most home runs. I also look to see how each of the 30 teams in the MLB compared when it comes to home runs hit in one season. The data was taken from Sean Lahman's baseball database. For more detail, see the full Repo on my GitHub.
Loading the data and importing libraries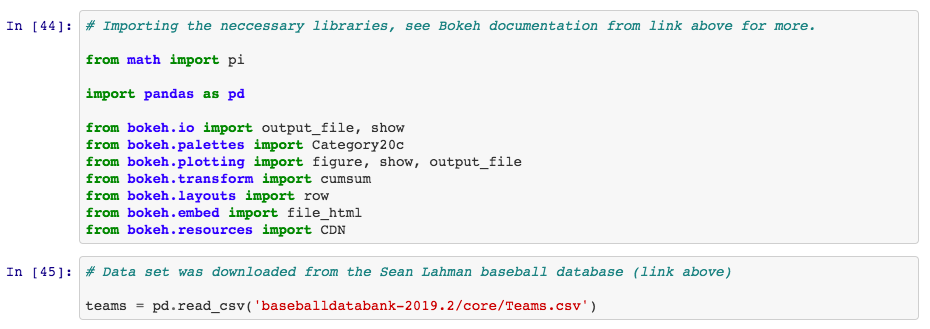
Selecting the right data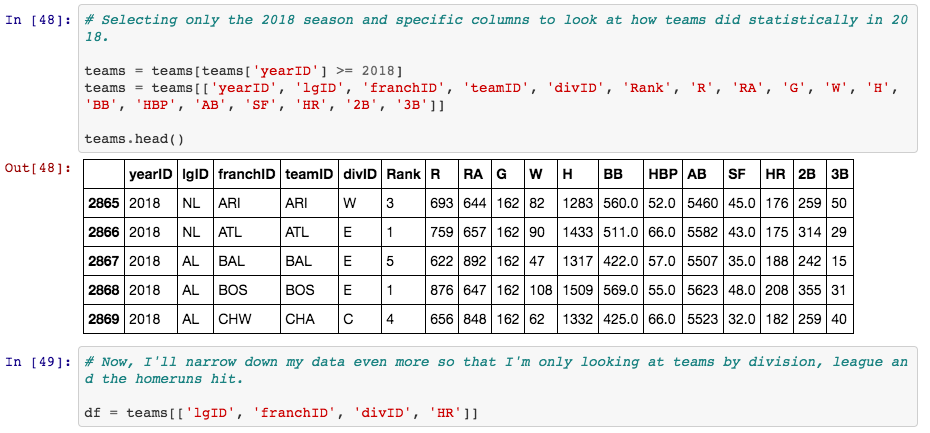
The Pie Chart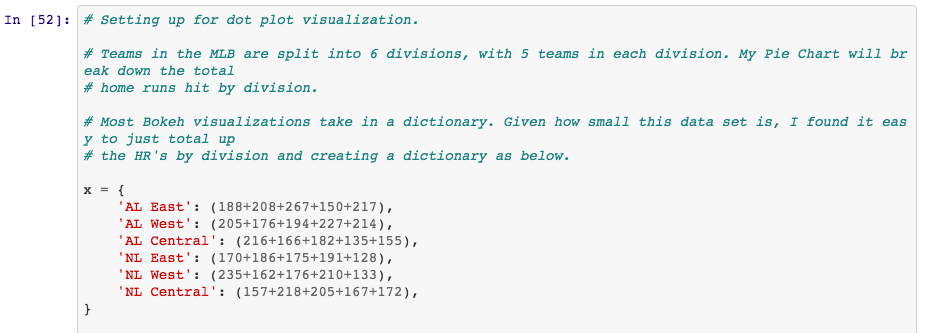
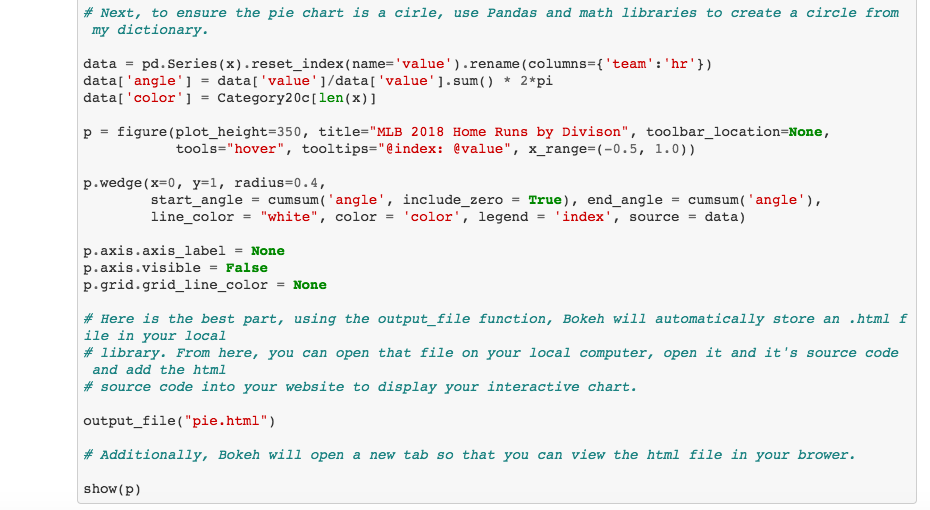
Adding the visualization to your blog or website.
Now, this is the real reason, for me at least, to use Bokeh. Now that you have called the output_file function above, you can go to your local directory to find that file. In this case, the "pie.html" file. Open the file, view it in your browser, open the source code (in Chrome you click View -> Developer -> View Source) and copy the HTML code. Since, for this blog post, I am using Weebly, I simply drag an Embed Code box into my blog post and paste my HTML code into box.
As you can see by scrolling over the slices of the pie, the AL East led the majors with 1030 dingers in 2018, with over 100 more home runs hit than the NL Central.
The Dot Plot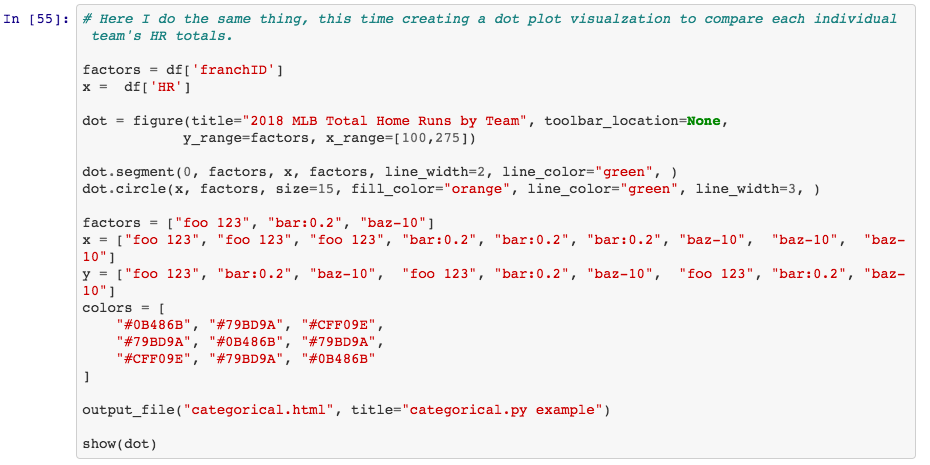
A member of the AL East, the New York Yankees led all of Major League teams with 267 home runs.
Now, you can see how useful Bokeh visualizations can be for Data Scientists communicating their findings through blog posts. Rather than having to copy and paste, or screen shot images, you can create clean, interactive visualizations to be embedded into your site.
0 Comments
How to interpret multi-linear regression coefficients when using dummy variables from categoricals4/6/2019 Never in my life did I think I would be writing a title with such a heavy load of technical jargon. But, for data scientists performing such an operation, this is a big topic. For a project I did in my first module at the Flatiron School, I was given a data frame including housing data from King County , Washington. For more information about this data, please take a look at the Kaggle competition site. I used this data to create a model that would predict, as accurately as possible, housing prices in the county. One of the tricky aspects of this dealing with a large quantity of categorical data. In this blog post, I will be explaining the evaluation aspect of the model, given that so many variables were category types. 1. Converting to Categorical's Specifically for the zip code variables, I converted to a categorical and created dummy variables so that each individual zip code could be isolated during the regression analysis. 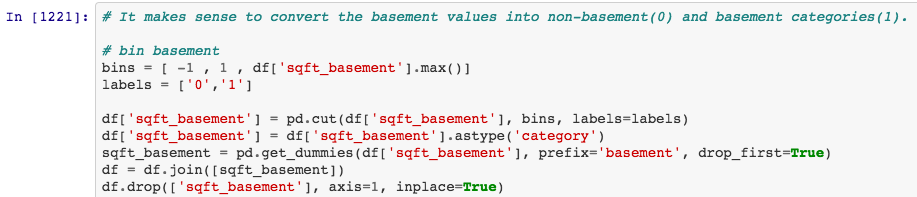 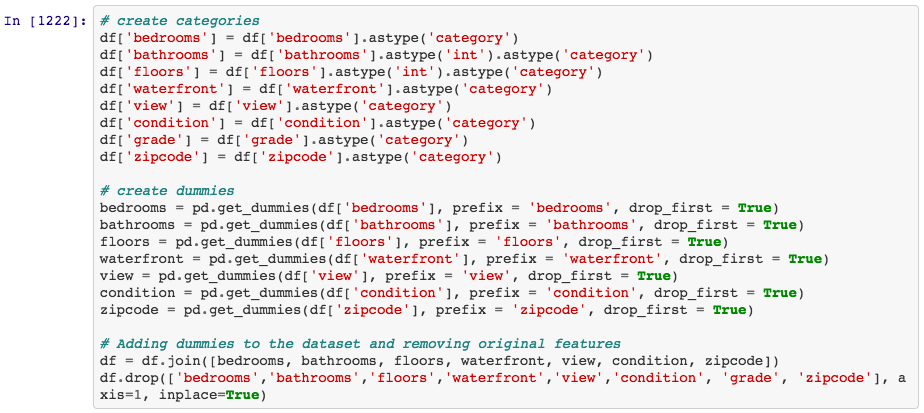 2. Log Transformations and Min-Max Scaling Once I converted to categorical's, numerical variables needed to be normalized. In addition, I needed to put all of my variables on a 0 - 1 scale in order to run the Recursive Feature Elimination (RFE) and to provide more accuracy in my model. 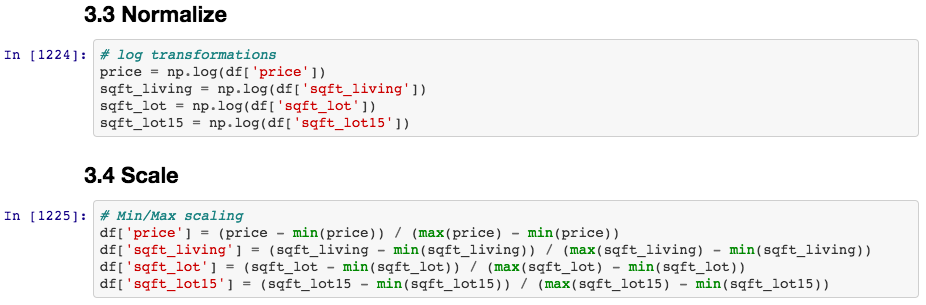 3. Recursive Feature Elimination (RFE) Running the RFE showed that 2 different zip codes made it into the list of the top 5 most important features to include in my model. 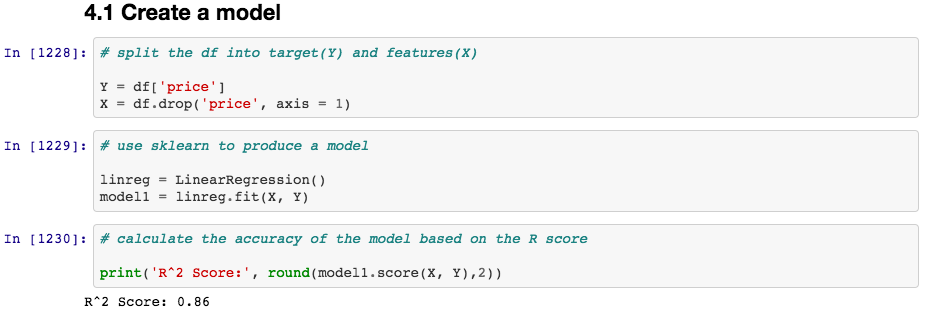 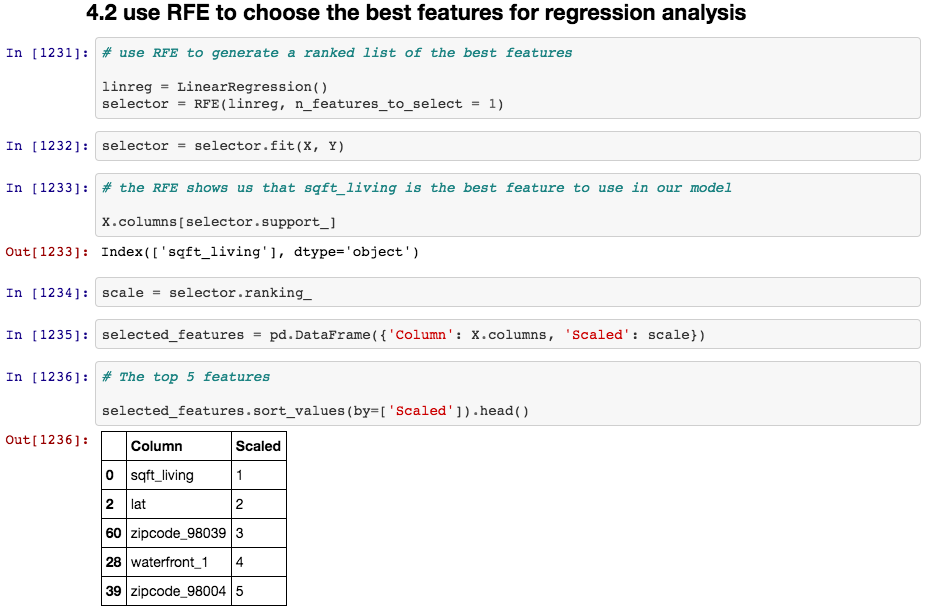 4. Evaluating the Zip Code Coefficient When looking at the coefficients in my model, how do I interpret an individual zip code and it's influence on price? Does it mean that increasing from zip code 98039 to zip code 98040 will increase price by a certain amount? Or, does it mean that houses in zip code 98039 will increase price by that amount? Remember that my zip code variables were converted into categorical variables and my price variable was log transformed. So, using any zip code coefficient would essentially mean that price is influenced that much by the house being or not being located in that location. In order to make sense of this coefficient, we would have to convert or predictors back form log transformation and normalization. 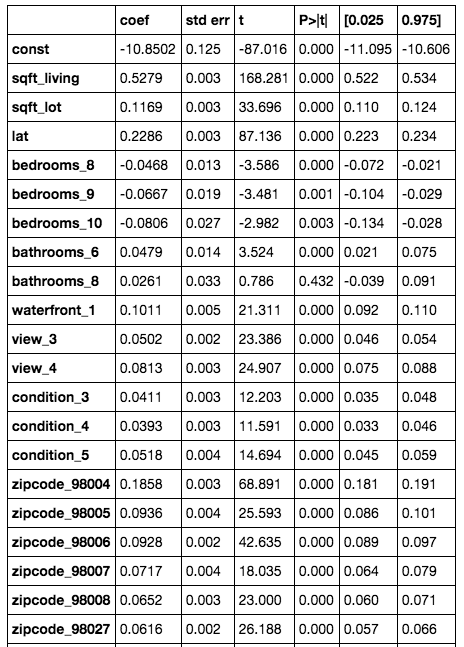 |
 RSS Feed
