|
I was first introduced to the practical use of data science in the form of professional baseball. Reading books like, Moneyball, by Michael Lewis, Big Data Baseball, by Travis Sawchik, and more recently, Astroball, by Ben Reiter, I started to learn the ways in which data science was giving baseball teams a competitive edge. I was intrigued by the way mathematics and a deep analysis of data could project a baseball player's likelihood to succeed in the major leagues and how analysts were using big data to find hidden value in players. Take for example the story of catcher Russell Martin as written in Big Data Baseball. Author Travis Sawchik writes of how data scientists working for the Pittsburgh Pirates analyzed pitch data, using MLB's Pitchf/x technology, to discover Martin's ability to "frame" pitches and how that ability translated to more wins for the team overall. By looking at data on called balls and strikes by the umpire during Martin's career, they found that the amount of pitches that should have been called balls that Martin was able to "frame" into called strikes was above average. Analysts were then able to use this statistic to calculate how many runs the catcher Martin was able to prevent, given the number of pitches he was able to manipulate into called strikes by the umpire, simply by the way in which he caught the ball and subtly moved his glove into the strike zone, otherwise known as pitch framing. This ultimately led to more strikes called for the Pirates pitchers and gave the team a competitive advantage. Only through the analysis of large data sets were the Pirates able to see that Martin had this ability and sign him to a contract from the free-agent market, obtaining an edge at discounted cost. 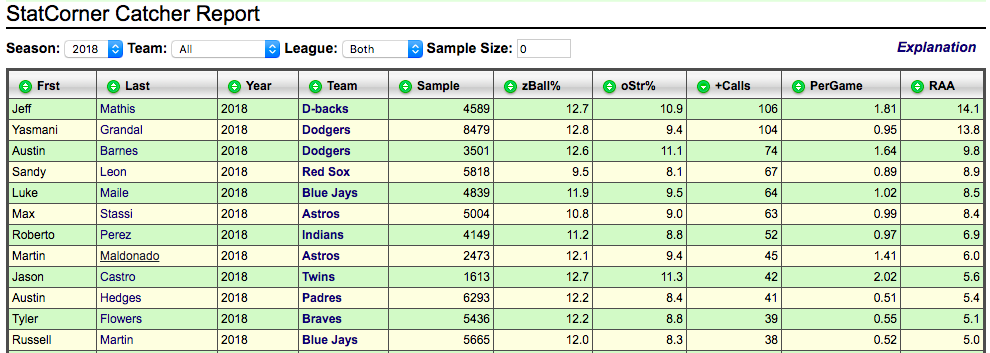 This chart provided by Stat Corner shows that in 2018 Russell Martin is still within the top 15 catchers in the major leagues with top pitch framing ability, with an oStr% (called strikes that were outside of the pitch zone that should have been called balls) of 8.3. As I became more and more interested in baseball data and the research questions analysts were answering using publicly available baseball data, I was led to Fangraphs.com where bloggers ask and answer great baseball questions on a daily basis. I started to crave the ability to analyze data on my own and wanted to write my own blogs about baseball data findings, but I had no idea how to use the R and Python programming tools that analyze these large data frames. So, I bought the book, Analyzing Baseball Data with R and started to teach myself. Slowly but surely I began experimenting and learning more and more. I began writing my baseball articles where I could communicate some of my findings. The more I learned the more I started to think beyond baseball. Wondering where else this work was being done, I started to research the job market for data scientists. 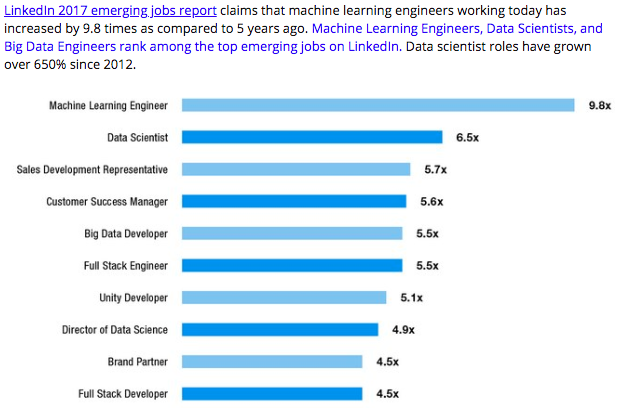 This graph, taken from KDnuggets, shows the growth in the job market with data scientist positions increasing 6.5 times as compared to 5 years ago. I began to see that there is data to be analyzed everywhere and the opportunities to find my niche in the world of data science is very practical. As I continue on this journey of becoming a data scientists, I hope to mold together the experiences and skill sets from my current career as a science teacher and environmental educator, with a new skill set in technology. I am particularly excited about the prospect of continuing to wear my teacher hat by presenting technical and statistical findings to others and explaining a complex analysis in a way that everyone can understand. In the short term, I hope to learn everything I can about the tools and programming styles that analyze the large datasets that move big decisions forward in today's world. I hope to earn a position working for an organization to help move those big decisions and make an impact on the world. Finally, I hope to continue my baseball blog and data analysis in hopes that one day I could become a (somewhat) respectable analyst and baseball writer.
0 Comments
|
 RSS Feed
