|
If you were suddenly unable to drive your car at the speed limit on the highway, would you be concerned? Sure, you could slide on over to the slow lane and cruise to your destination with a little more of an easy going, "I don't really need to get anywhere fast", kind of vibe. Or, you could anxiously stare at your dashboard, waiting for the check engine light to turn on while continually looking in the rear view to make sure smoke isn't pouring out of your tailpipe. Whether your talking about your car or your favorite starting pitcher, it is important to know if there is a real problem that requires a trip to the mechanic or not. A dashboard can now be created for pitchers utilizing data visualization and the average velocity of their pitches over a time period. For starting pitchers in the MLB, PITCHf/x data is analyzed to show average pitch velocity per game. Extremely high definition cameras installed in every baseball stadium in the MLB record information for every pitch thrown. Here is an example of one of the best pitchers in the game, Clayton Kershaw, and his average fastball velocity per game over the 2018 season: 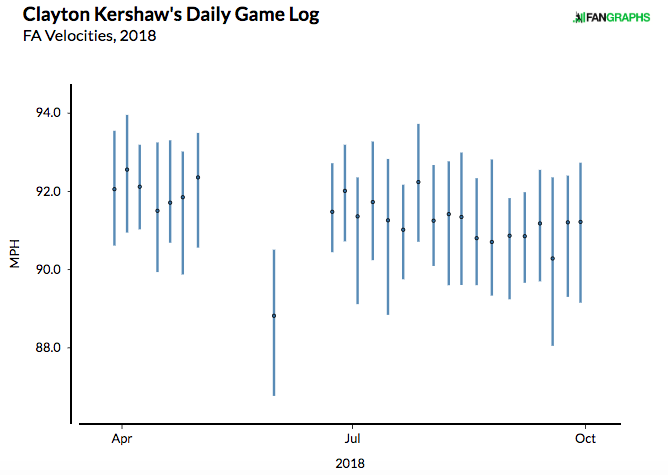 Image provided by Fangraphs.com This simple graph can tell a coach, a pitcher, an opposing team or hitter a lot. Generally, we can see that in the 2018 season, Kershaw's fastball was mostly in the 90 - 94 mph range. However, many Los Angeles Dodgers and Kershaw fans are worried about his declining velocity over longer periods of time. If we now look at this same information and visualization, but add in 3 more previous seasons, we can see why fans might be worried. 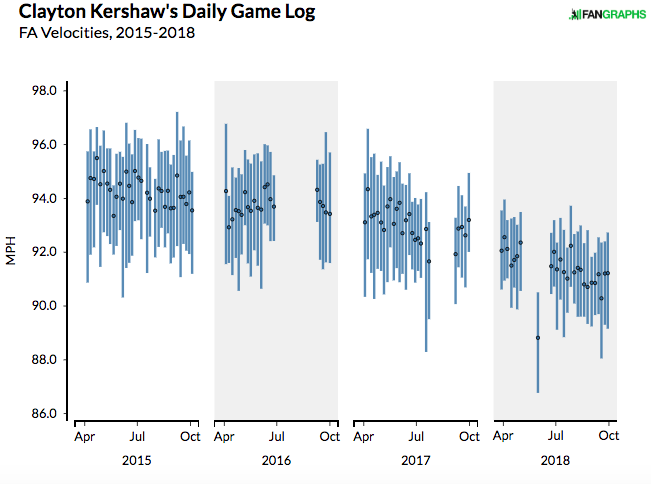 Image provided by Fangraphs.com In baseball, a pitcher's fastball velocity is one of the biggest measurements of talent. There have been a few studies done on a pitchers and the impacts of a declining fastball velocity, but for now, let's just say it's usually not associated with good. However, because of visualizations like these being produced for pitchers and baseball organizations, better decisions can be made such as cutting back on the innings an aging pitcher takes the mound during a season, or changing the types of pitches a pitcher throws. There have been many aging pitchers who have used visualizations like these to change their style of pitching to include a heavier reliance on lower speed pitches and effectively extend their careers.
Thanks to PITCHf/x technology, what was once written down on a clipboard after looking at a radar gun and spitting tobacco juice in between pitches, is now automated and used to create useful visualizations.
0 Comments
|
 RSS Feed
