|
Cumulative statistics can be a tricky thing. How often does the baseball world see a prospect or a young hitter come up, make a huge splash by hitting 4 home runs in his first 3 games and then end up back in AAA by mid-season? I've always been curious as to why that happens. Is it adrenaline? Is it because the pitcher has no scouting report on this new hitter and thus just lobs a 'whatever' right over the heart of the plate?
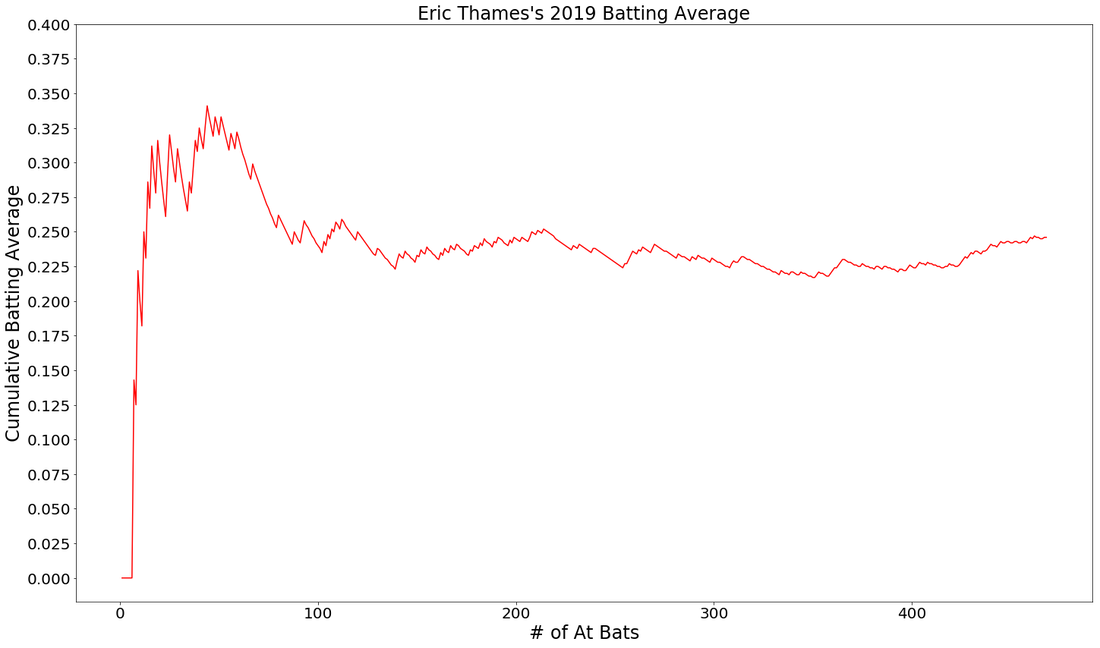
I think back to Eric Thames and the incredible start he had in 2017, hitting homers like a mad man in his 'back for revenge' season after playing in Japan the previous year. Let's just say, Thames went off! But, it didn't last long. By the end of his first 100 AB's, he started to come back down to earth or, regress, as it is. Eventually, a player regresses back to what would be closer to a career average. This post isn't about regression, it is simply showcasing a function that will allow python users to visualize a cumulative statistic, in this case, batting average. When downloading Baseball Savant game data, there are a few things that need to be fixed up before you can visualize a player's average over the course of the season. See the function below and the comments for all the steps I took.
Now that you have your data, you've cleaned it up and you're rounding 2nd, it's time to visualize!
By visualizing and looking at Thames over the course of the season, we can see this hot start didn't last long.
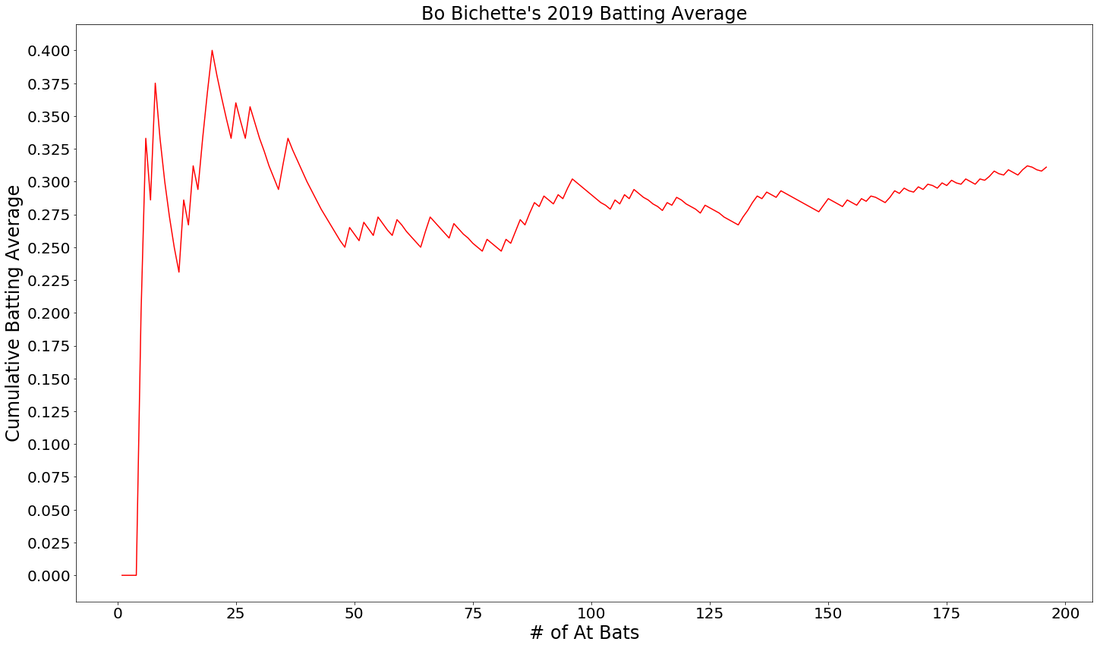
Let's take a look at a few examples of younger hitters. These graphs are fun to look at because we don't really know for sure what they are expected to regress to because they've haven't played much. Here you see 2nd year Juan Soto and Rookie Bo Bichette.
NOTE: I dropped these batters first 2 AB's if they got hits, just to remove 1.000 from the image. 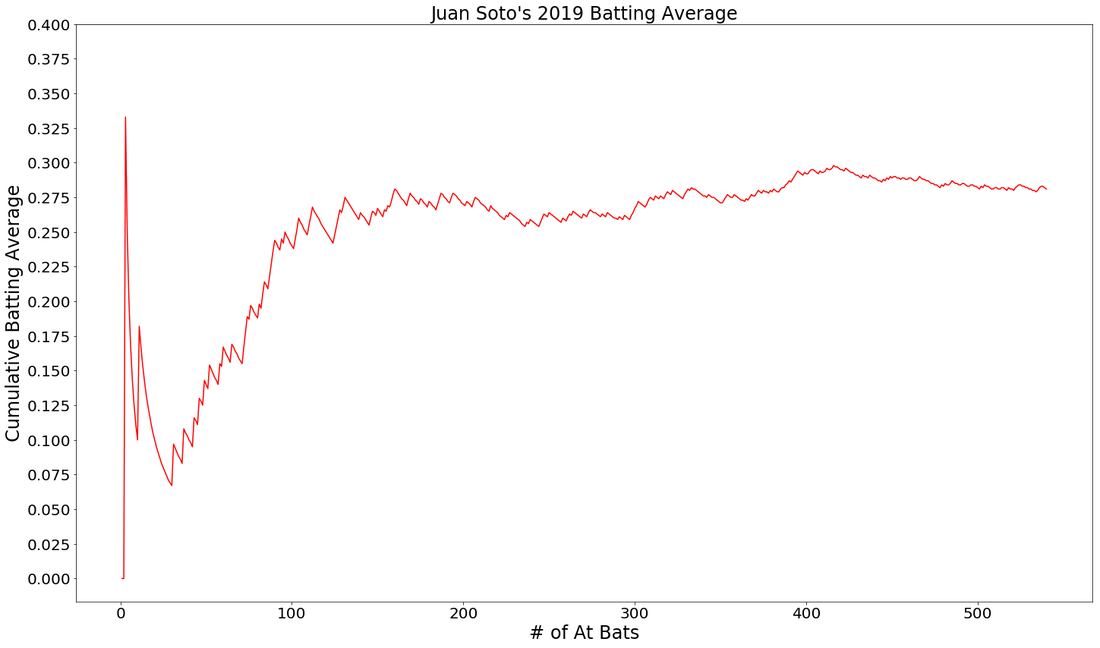
Will these images allow you to deeply evaluate a player or make clear projections? Probably not. But, they do allow you to see that cumulative stats, like a batting average, can tell a story. With vertical markers we could point out injury spells, slumps, streaks and other points in time where there was some kind of influential side note. If you could only look at these graphs, which hitter would you rather have on your team in 2020?
0 Comments
I have a plan, that is, once the baseball season finally kicks off. Don't tell anyone, ok? I'm going to try to Beat The Streak. The streak is one of baseball's seemingly most unbeatable records. The record is 56 hits by a baseball player in consecutive games. Joe Dimaggio got a hit 56 games in a row in 1941. The only player to have even come anywhere near this record in my lifetime was Jimmy Rollins in 2005 and 2006, a continuation from one season to the next that some baseball purists would place an asterisk next to.
For those of us who mostly interact with the great game of baseball through computer screens, MGM has given fans a chance to hit 57 consecutive games in a row and win $5.6 million. MGM has even made it much easier for fans. You don't have to choose 1 player that you think will hit 57 games in a row, you can choose many MLB players to accumulate hits. The only requirement is that the player you've chosen must get a hit the day he is chosen. Choose correctly, you add another hit tally to your mark. Choose incorrectly, you go back down to zero. Your goal is to choose 1 player each day to get a hit and do that 57 times in a row. In case your confused, let's go through an example. Day 1: I choose Manny Machado, he get's a hit! Hit tally = 1 Day 2: I choose Nolan Arenado, he get's a hit! Hit tally = 2 Day 3: I choose Trea Turner, 0-4, no hits. Hit tally = 0 It's harder than you think. No one has succeeded in 16 years, but some have come close. I've played for a few years now and I don't think I've every gotten past 15. Now, rather than going in blind, here's my plan to use machine learning and predictive analytics to Beat, The, Streaaakkk!! * Hopefully baseball comes back and MGM continues this contest so that all this work is actually useful 
Step 1.
What I need to do is.....wait....this is a contest in which I could potentially win $5.6 Million. Do you really think I'm going to spell it all out for you right here, right now? In truth, predicting a hit in a baseball game is difficult. How difficult? A few mathematically minded individuals posted on Reddit about just that. So, knowing that the chances of building a successful and sound predictive model to win this contest are, let's say, slim...what the heck! Hopefully if you're reading this and you see some flaws or suggestions, you can point them out and we can try to, "Beat, The, Streeeaakk!", together. Step 2. I've downloaded as much batted ball data as I can from Baseball Savant and I think it will be enough. With 40,000 events and 89 individual features, I've certainly got enough to get started.
Step 3.
Designate and create the target column. I'm trying to predict a hit. A hit can be a single, double, triple or home-run. Anything else, won't do. In my dat, I have two columns, "events" and "description", that need to be investigated. See code below:
Step 3 cont,.
I need to turn the 'events' column into a hit/non-hit categorical column that will be used as my target during modeling. Here's a function built to label these occurrences as a hit/non-hit.
Step 4.
Gathering this data was pretty easy. Now, I have clean it up and do some exploring. Tune in to my next post showcasing interesting visualizations and findings! |
 RSS Feed
